Geoscience Reference
In-Depth Information
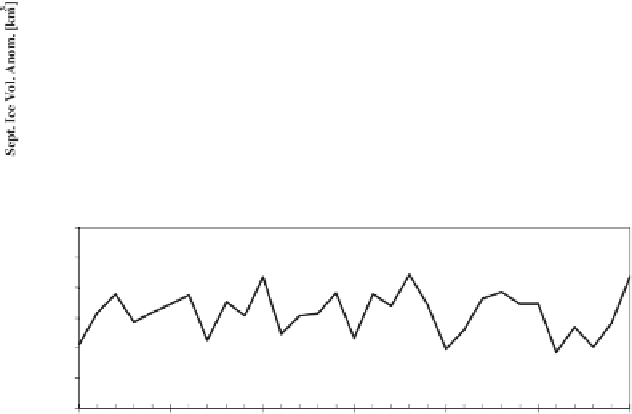
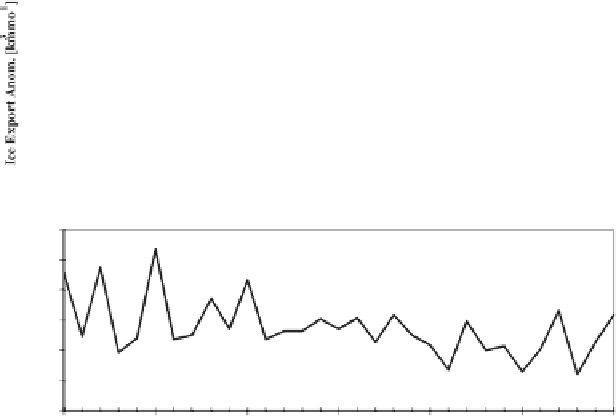
Figure 6.
Time series from ccSm3 control simulation for model years 480 to 510 indicating (a) September Northern
Hemisphere sea ice extent expressed as an anomaly of the averaging period 250-599 in 10
6
km
2
, (b) September Northern
Hemisphere sea ice volume anomaly in km
3
, (c) Fram Strait southward ice export anomaly for November through April
in km
3
month
-1
, (d) January through December central Arctic sea ice melt anomaly in cm d
-1
, and (e) the July through
September net surface radiative flux in W m
-2
averaged for the region from 70°N to 90°N.


Search WWH ::

Custom Search