Geoscience Reference
In-Depth Information
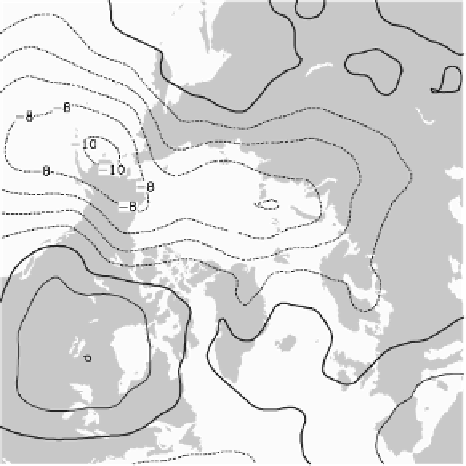
Figure 5.
Sea level pressure anomaly from the ccSm control simulation for model year 451, averaged for (left) Novem-
ber through April and (right) may through September. The contour interval is 2 hPa. Hatched areas denote significance
at the 95th percentile.
anomalies for September are largely focused on the Pacific
side of the Arctic, with significant losses in the Beaufort and
chukchi seas as well as in all of the eurasian marginal seas.
Figure 6 shows the time series of several simulated Arctic
climate variables along with the ice extent anomalies for the
years before and after year 490. As seen in Figure 6a, the
ice extent anomaly abruptly drops from near climatology
values to a local minimum of 0.18 × 10
6
km
2
for simula-
tion year 490. In the following September, the ice extent is
slightly larger than the long-term average, and there are sub-
sequent positive and negative anomalies over the following
20 years.
This variability in the ice extent time series is in substan-
tial contrast with the time series of ice volume. As seen in
Figure 6b, the extent minimum occurs during a long-term
downward trend in ice volume which begins in year 481 and
declines by approximately 7400 km
3
over the following 18
years. The ice volume minimum in the year 499 of 8188 km
3
(which is plotted in Figure 6b as an anomaly of -4916 km
3
)
is the lowest value in the 350-year time series that is con-
sidered here. The decrease in ice volume is characterized by
above-average summer ice melt throughout the period and
particularly during the years 496-499. Positive AO index
values over the time period (not shown) and enhanced ice
export through Fram Strait (Figure 6c) play a lesser role in
the decrease of ice volume over the period 481 to 499. As
with the previous minimum ice extent event, the time series
of ocean heat transport is unremarkable.
In the presence of weak atmospheric wind forcing, a
near-normal ice export, and oceanic heat transport but in-
creased melting, this event may be characterized as a ther-
modynamic event which occurred during a period of low ice
volume. Shown in Figure 6e is the summertime net surface
radiative flux that has been averaged over the central Arctic
region as defined earlier for ice melt. This curve peaks in
year 490 and is approximately 5 W m
-2
greater than found
in the prior decade. A great deal of this peak in the radiative
flux is associated with the shortwave component. The net
surface shortwave flux exceeds the climatological value by
more than 5 W m
-2
in May of that year and by more than 20
W m
-2
in June.
The effects of the increased radiative flux on the sea ice
cover are illustrated in Figure 7, which shows the annual
cycle of sea ice melt compared with long-term average of the
simulation. For reference, adjacent years in the time series
are also plotted. For example, it may be seen in Figure 6d
that ice melt was anomalously large in simulation year 485.
This is reflected in Figure 7; however, the anomaly is cen-
tered with the climatological annual cycle. In contrast, the
melting of sea ice in year 490 began much earlier and was
anomalously large in march (which may not be noticeable
in Figure 7). By complementary association, the presence


Search WWH ::

Custom Search