Geoscience Reference
In-Depth Information
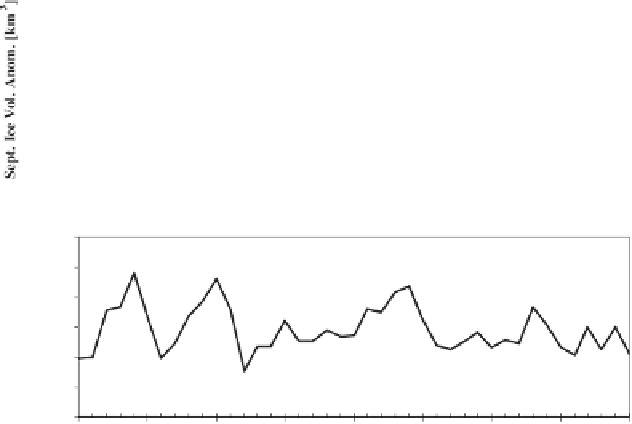
Figure 4.
Time series from ccSm3 control simulation for model years 440 to 480 indicating (a) September Northern
Hemisphere sea ice extent expressed as an anomaly of the averaging period 250-599 in 10
6
km
2
, (b) September North-
ern Hemisphere sea ice volume anomaly in km
3
, (c) Fram Strait southward ice export anomaly averaged for November
through April in km
3
month
-1
, (d) January through December sea ice melt anomaly in cm d
-1
, and (e) the first principal
component of the monthly Northern Hemisphere sea level pressure anomaly as computed over the period 250-599 and
representing 23.6% of the variance.


Search WWH ::

Custom Search