Geoscience Reference
In-Depth Information
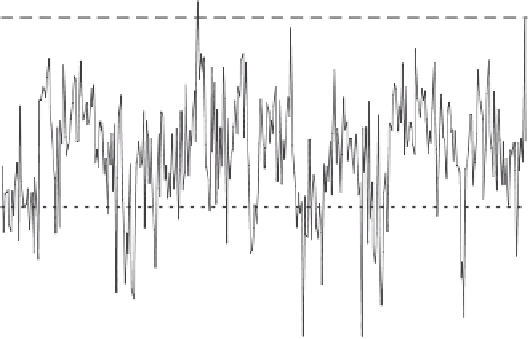
Figure 3.
(top) Time series of September monthly sea ice extent (concentration greater than 20%) for ccSm3 control
simulation, in 10
6
km
2
. The observed minimum (2005) and maximum (1980) September sea ice extent from the 1979-
2006 period is indicated along with the record minimum extent from 2007. (bottom) Time series of September monthly
sea ice extent compared with march. Note the right vertical axis corresponding to the time series for march.
with particular emphasis in the chukchi, east Siberian, and
laptev seas (Plate 3a). Figure 4 shows time series of simu-
lated climate variables that are associated with this event as
well as the time series of the September sea ice extent anom-
aly. The purpose of Figure 4 is to present an overview of the
model variables that have been examined, which necessarily
requires a prioritization of the results but which shows the
evolution of the simulation over the time prior to and after
the period of interest. The variables shown characterize the
Arctic sea ice cover, the wintertime export, and the monthly
atmospheric circulation.
The time series of the first principal component of North-
ern Hemisphere sea level pressure variability, otherwise
known as the Arctic Oscillation (AO) index [
Thompson and


Search WWH ::

Custom Search