Geoscience Reference
In-Depth Information
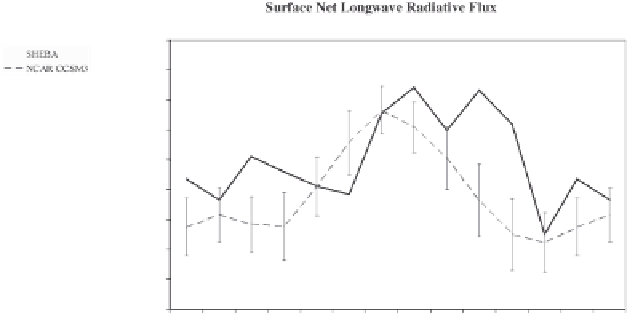
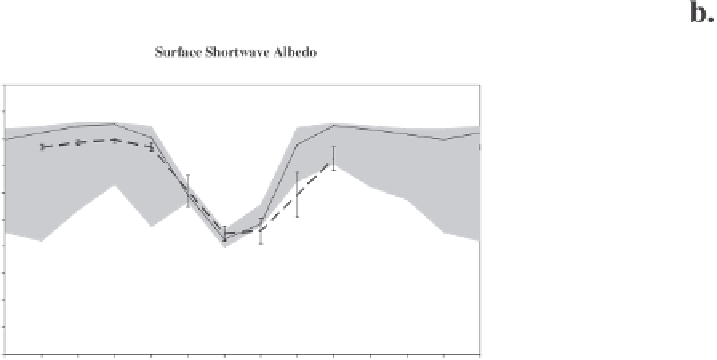
Figure 2.
monthly averaged surface energy budget components from observed SHeBA station data and corresponding
values from the NcAr ccSm3 1990 control simulation. model values are from the grid box colocated with the monthly
mean position of the SHeBA station. error bars correspond to the standard deviation over simulation years 250-599. Shown
are the (a) net (downwelling minus upwelling) shortwave and (b) longwave radiative fluxes in W m
-2
, (c) albedo, and (d)
sensible and (e) latent heat fluxes in W m
-2
. Shaded area of the albedo plot indicates the range of SHeBA observations.


Search WWH ::

Custom Search