Geoscience Reference
In-Depth Information
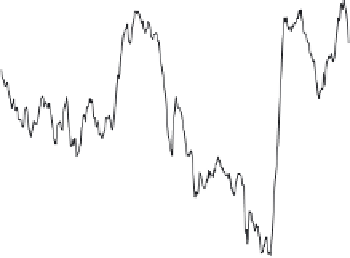
Figure 3.
Time series of maximum (solid curves) and minimum (long dashed curves) values of (left) Arctic sea ice extent
(10
6
km
2
) and (right) their dates of occurrence, determined from 5-day running mean data. The dotted curves show the
time series of the maximum-minus-minimum sea ice extent and the date of minimum extent minus the date of maximum
extent. Linear trend lines are superimposed using data before 1 June 200.
kilometers per decade) and relative magnitude (percent per
decade, taken with respect to the long-term mean extent for
each 5-day running mean period). All trend values are statis-
tically significant at the 95% level. The linear trend is nega-
tive at all times of year, with the largest magnitudes (0.55 to
0.65 × 10
6
km
2
per decade or to 10% per decade) from the
end of July to the middle of October when the mean sea ice
extent is smallest (recall Plate 1). The relative magnitude of
the trend has a larger seasonal dependence than the actual
magnitude, ranging from a maximum value of nearly −10%
per decade in mid September to a minimum value of −3 to
−4% per decade from November through June. The actual
magnitude of the trend ranges from a maximum value of
−0.65 × 10
6
km
2
per decade in early October to a minimum
value of −0.4 to −0.5 × 10
6
km
2
per decade from November
through June.
Trends in the dates of maximum and minimum sea ice ex-
tent were presented in Figure 3 (right). Another approach to
characterizing the timing of the seasonal cycle is to examine
the date when sea ice concentration first falls below 50% and
when it first exceeds 50% at each grid point for each year.
Plate 2 shows the geographical distributions of the trends
in these dates along with the corresponding long-term mean
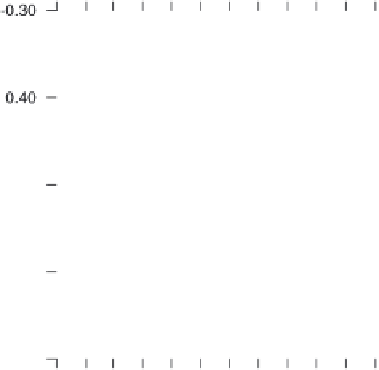
Figure 4.
Linear trends in Arctic sea ice extent as a function of time
of year based on 5-day running mean data for the period 1 January
199 to 30 June 200, expressed in terms of actual magnitude (km
2
per decade, solid curve) and relative magnitude (percent per dec-
ade, taken with respect to the long-term mean extent for each 5-day
running mean period, dotted curve).


Search WWH ::

Custom Search