Geoscience Reference
In-Depth Information
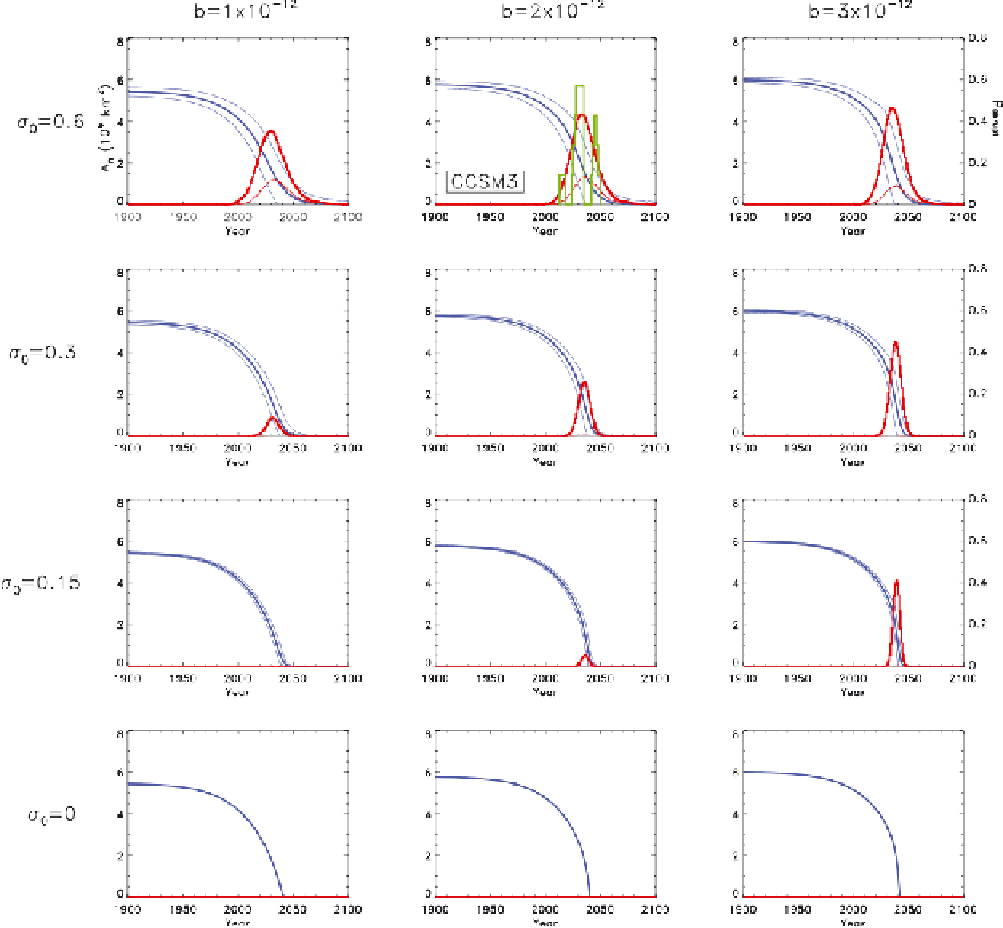
Plate 1.
Statistical properties of 10
4
member ensembles of solutions to (6) - (8) for indicated values of albedo feedback
parameter
b
(in W m
-4
) and OHT variability parameter s
0
(in W m
-2
). Thick blue curves represent ensemble mean
A
n
, and
thin blue curves represent ranges of 1 standard deviation about these values (left-hand scale). Thick red curves indicate
probability that a given year lies within an interval of abrupt decrease in
A
n
, and thin red curves indicate probability of
an abrupt increase (right-hand scale). For the case with CCSM3 parameter values (top middle panel), the probability of
abrupt decrease as determined from an ensemble of seven CCSM3 simulations is indicated in green.

Search WWH ::

Custom Search