Geoscience Reference
In-Depth Information
Equilibrium solutions for the CCSM3 parameter values
listed in Table 2 are illustrated in Figure 9, where the solid
curves indicate stable (attracting) solutions and the dashed
curves indicate unstable solutions, as determined in Appen-
dix A. It is seen that, for values of
H
smaller than a critical
value
H
c
, there is a single equilibrium, described by one of
the solutions to (9) and denoted
A
e
in Figure 9a, for which
A
e
and
T
e
decrease smoothly with increasing
H
. For values of
H
larger than a second critical value
H
c
, there is again a single
equilibrium, described by (10) and denoted
A
0
, having
A
e
= 0
and
T
e
declining gradually with increasing
H
until
T
e
= 0
is attained for
H
³
F
/
w
-
bA
max
. In the intermediate regime
H
c
£
H
£
H
c
, these two stable equilibria coexist and are con-
nected by an unstable equilibrium branch
A
e
arising from the
second solution of (9).
At least three aspects of this result bear upon abrupt transi-
tions like those in Figures 1 and 7:
1. If
H
increases gradually from relatively small values
to values exceeding
H
c
,
A
will track
A
e
and hence decrease
smoothly until
H
=
H
c
. At this point, any further increase
in
H
will cause
A
to undergo an abrupt, hysteretic transition
from finite
A
e
to
A
e
= 0, as indicated by the downward arrow
in Figure 9b.
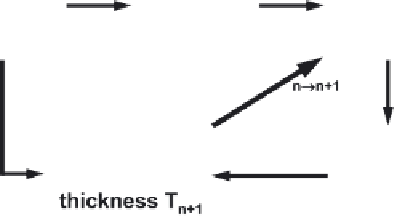
Figure 8.
Schematic illustration of the web of feedbacks repre-
sented by equations (6) - (8), indicating how the system responds to
an increase in ocean heat transport (OHT). The thick arrow repre-
sents the key nonlinearity, an inverse dependence of summer open
water area on the previous winter's ice thickness, whose basis is
discussed in section 3.2.1.
because (9a) is quadratic in
T
e
, there are potentially three
physically realizable (i.e., real valued and nonnegative) so-
lutions to (9) and (10). Expressions for these solutions and
for various critical values of the parameters are obtained in
Appendix A.
Figure 9.
(a) Equilibria
A
e
of September ice extent, for parameters representative of CCSM3, as a function of ocean heat
transport
H
. (b) Close-up of multiple equilibrium regime for
A
e
, showing hysteretic transitions at
H
c
and
H
c
(arrows). (c)
Equilibria
T
e
of March ice thickness. (d) Close-up of the multiple equilibrium regime for
T
e
. Solid curves denote stable
equilibria, and dashed curves denote unstable equilibria.


Search WWH ::

Custom Search