Geoscience Reference
In-Depth Information
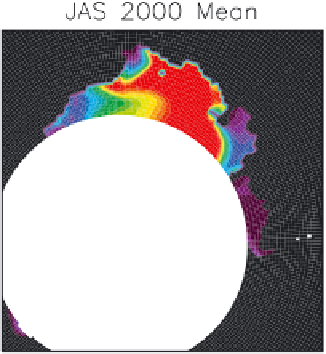
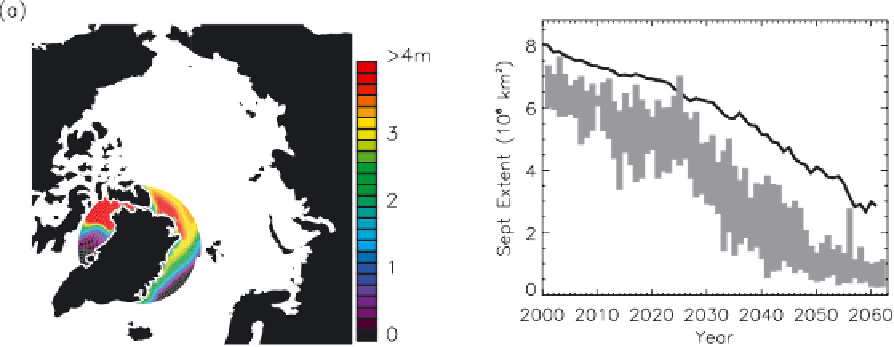
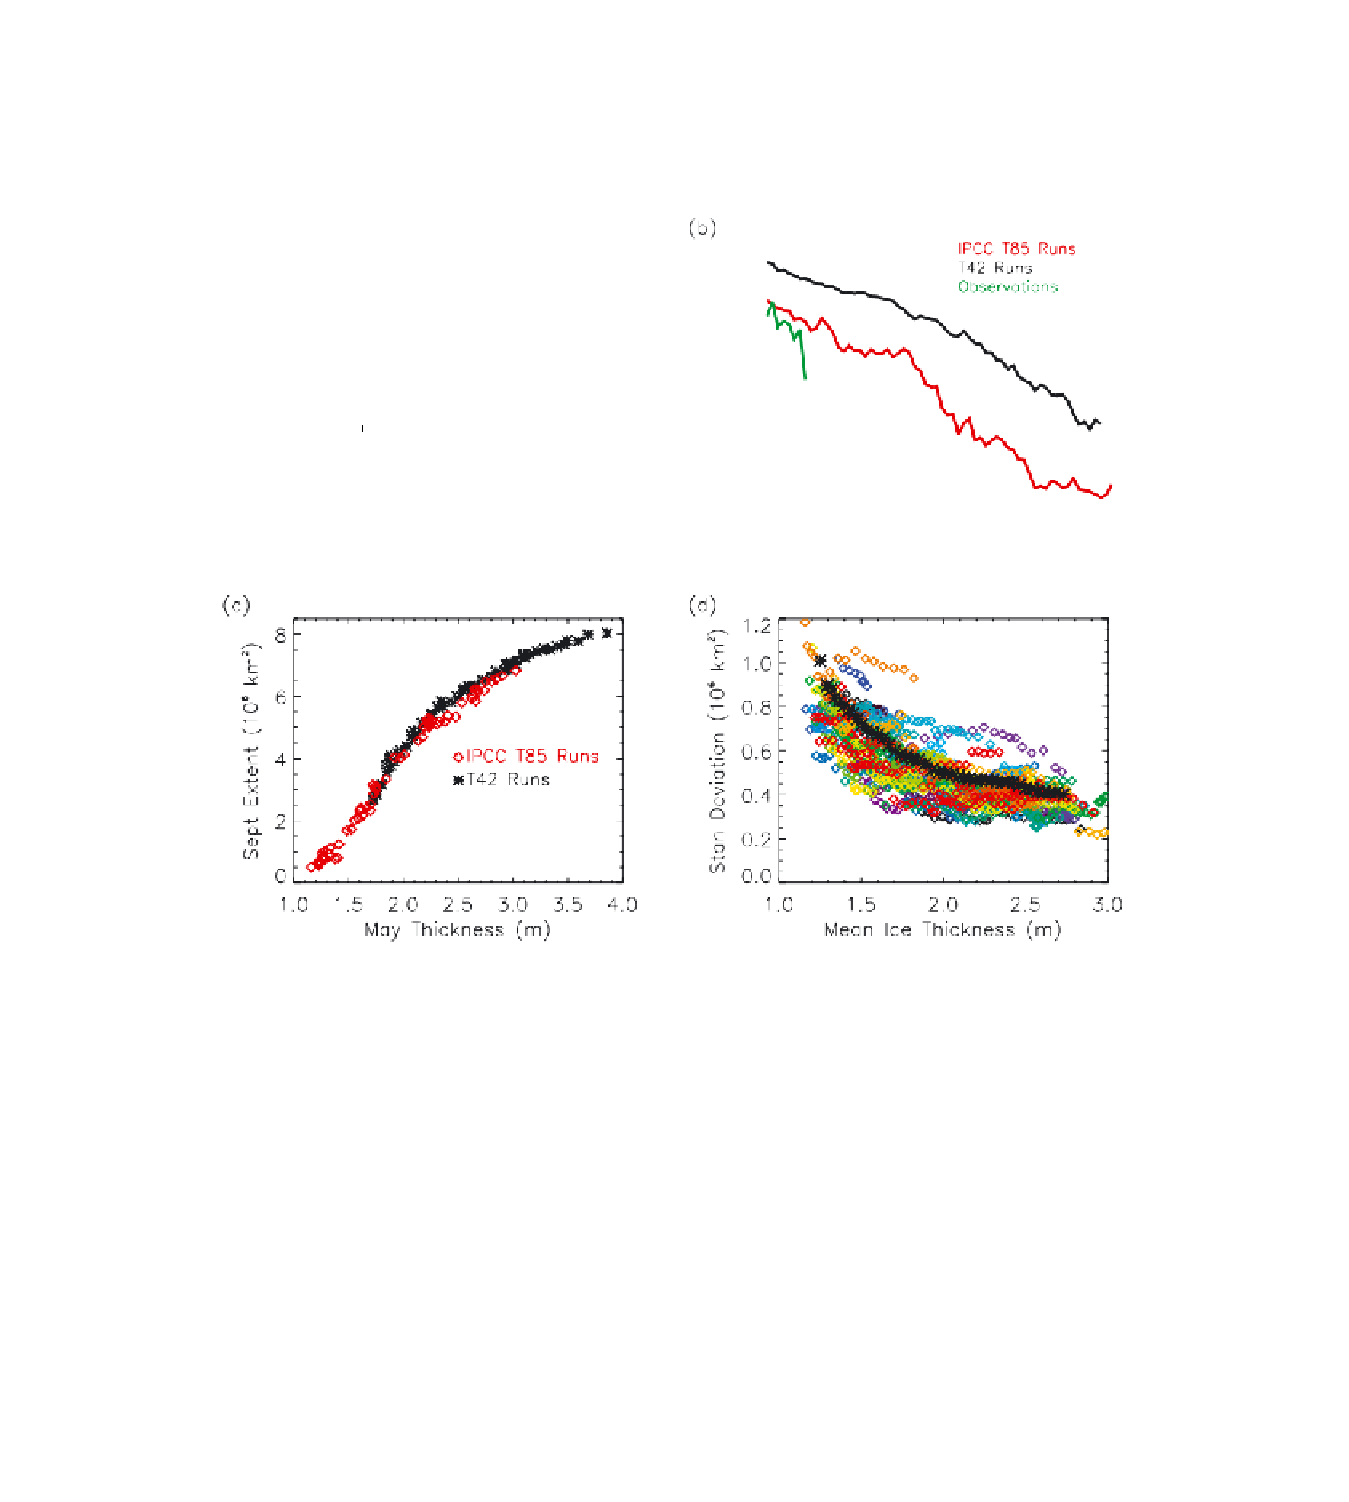
Plate 6.
Results from the coarse-resolution (T42) simulations. (a) Initial (year 2000) ensemble mean summer (JAS) ice
thickness for the T42 simulations. (b) Time series of ensemble mean September ice extent from the IPCC-AR4 CCSM3
simulations (red) and from the 29-member coarse-resolution (T42) CCSM3 simulations (black) with the range in the en-
semble members shown by the grey shading and the observed time series shown in green. (c) ensemble mean September
ice extent from these simulations shown as a function of their ensemble mean May ice thickness for each year from 2000
to 2062. (d) The 20-year running standard deviation of the September ice extent anomaly (as computed in Plate 5) versus
the mean ice thickness over a running 20-year period from 2000 to 2062 for the T42 simulations. The colored points show
values from each individual ensemble member, and the black points show the standard deviation computed across all of
the ensemble members for a running 20-year time period.


Search WWH ::

Custom Search