Geoscience Reference
In-Depth Information
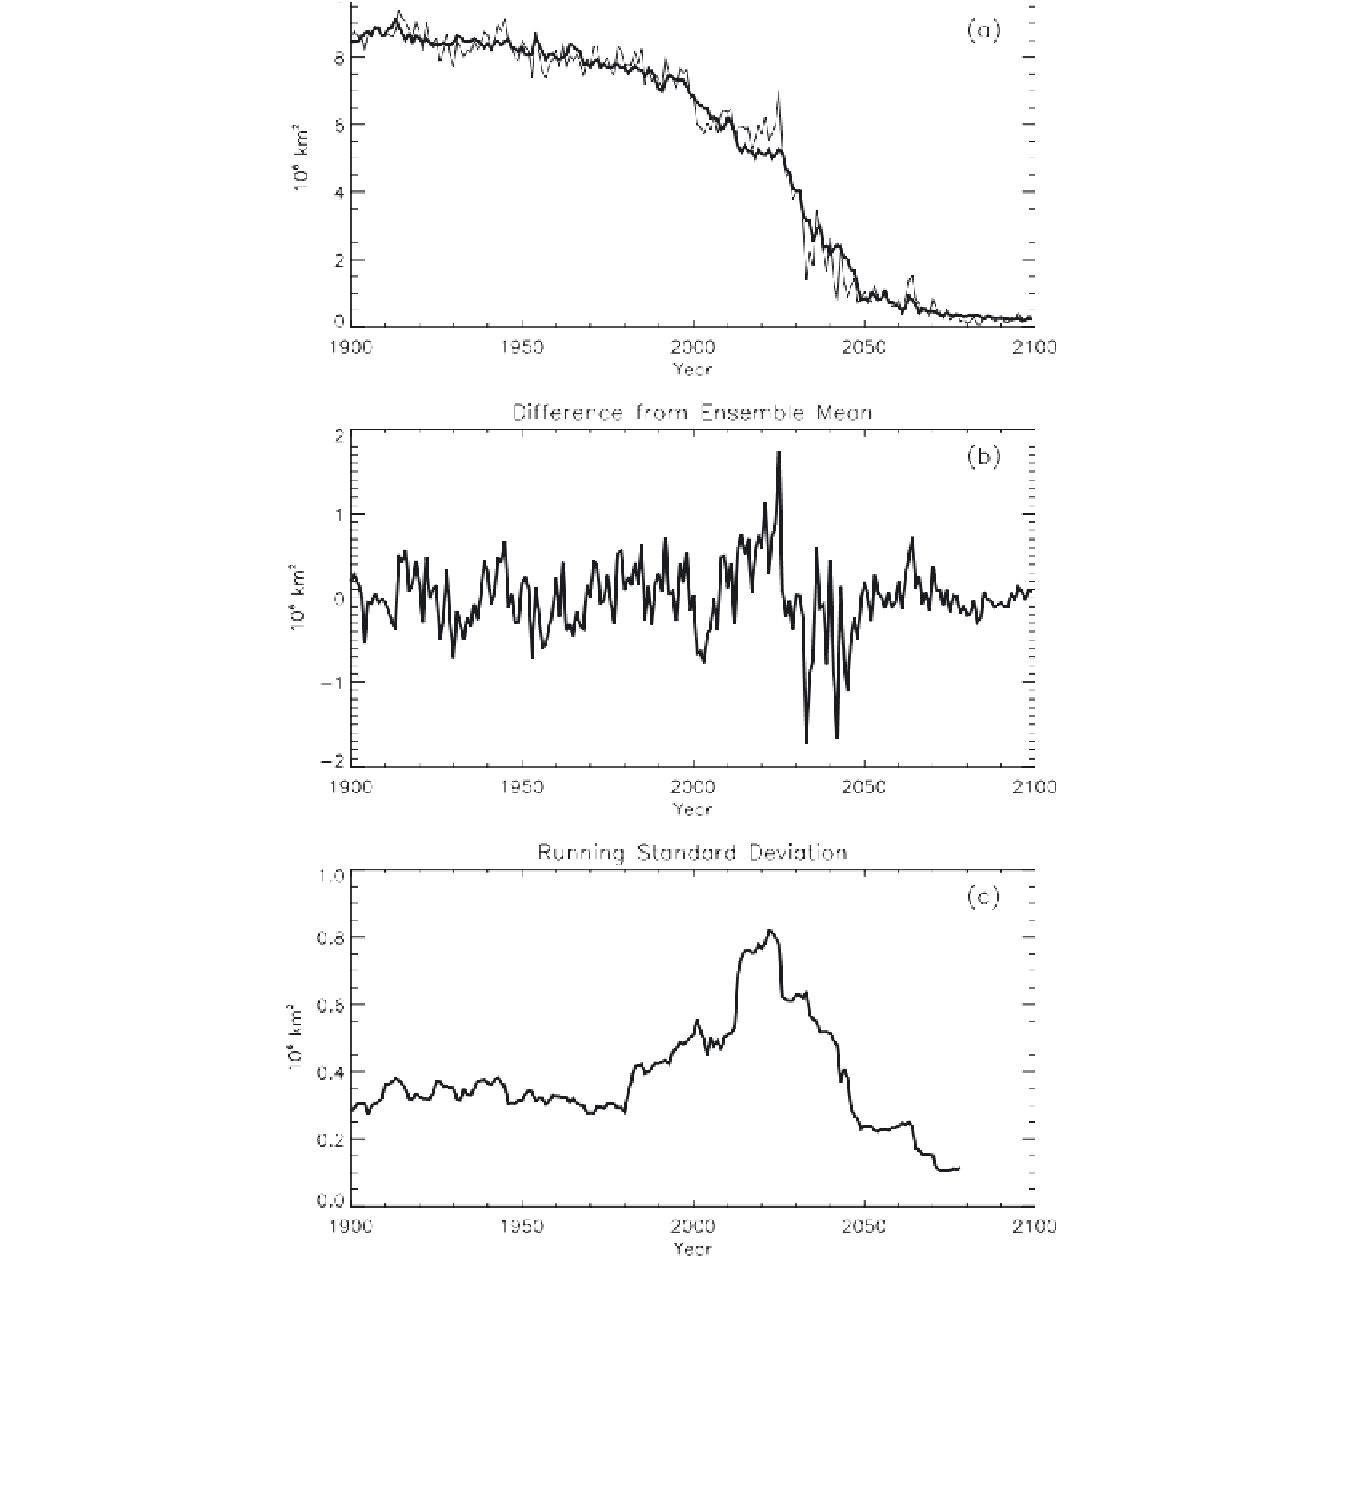
Figure 3.
(a) ensemble mean IPCC-AR4 CCSM3 September ice extent time series, (b) deviation from the ensemble
mean for run 1, and (c) 20-year running standard deviation of the September ice extent anomaly in run 1. In Figure 3a,
the thin line shows the September ice extent time series from run 1.
Search WWH ::

Custom Search