Geoscience Reference
In-Depth Information
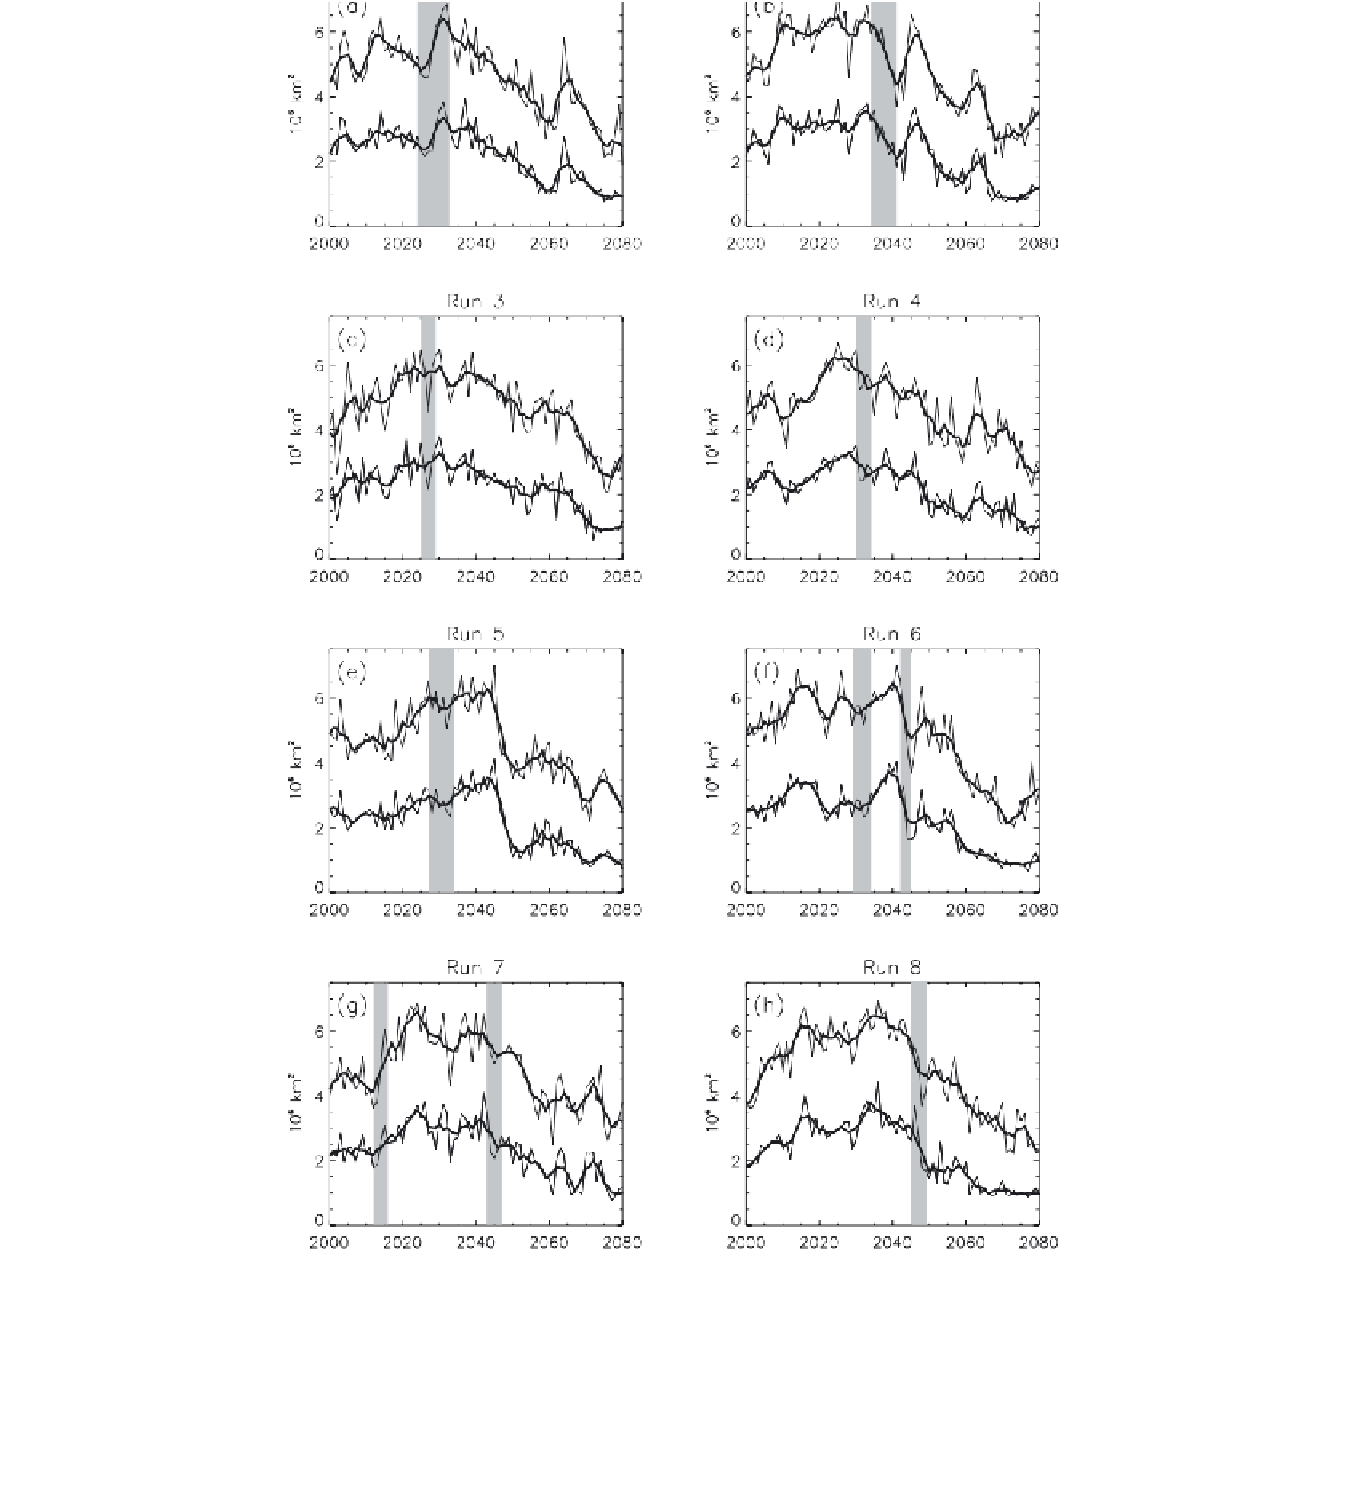
Figure 2.
Time series of the area of May ice cover that is within 50 and 25 cm of the ensemble mean ice thickness shown
in Plate 4, bottom right. Results from each of the eight ensemble members are shown, and each plot has two lines corre-
sponding to the area within 50 cm (top line) and the area within 25 cm (bottom line). The abrupt events for each ensemble
member are indicated by grey shading.
Search WWH ::

Custom Search