Geoscience Reference
In-Depth Information
850-hPa transient heat flux, 200-hPa transient momentum
flux, and 500-hPa omega variance are shown in Plate 5. All
of the mean model storm track measures in the control simu-
lation (Cntle) display maxima in the eastern Pacific, east-
ern North Atlantic, and central Eurasia (Plate 5, contours).
These maxima are qualitatively similar to observed maxima
[see
Zhang
et al.
, 2004, Figure 2b]. Decreased ice (Sum95e)
leads to a general weakening of the storm tracks through-
out the hemisphere (Plate 5, blue shading); however, the
primary significant response is in the Pacific sector. There
is a small region of enhanced storm track activity over the
east Siberia-Bering Sea region (Plate 5, red shading). Note
that an increase in 500-hPa height variance signifies both
the passage of more highs as well as lows. The band-passed
500-hPa omega vertical velocity variance anomalies (Plate
5d) are consistent with the height variances. The 2- to 8-day
band-passed 850-hPa v'T' or transient eddy heat fluxes are
reduced over the mean storm track in the North Pacific and
enhanced to the north in eastern Siberia-Bering Sea. In addi-
tion, the transient eddy heat fluxes at 850 hPa display signifi-
cant reductions in storm track activity over North America
into the North Atlantic. The 2- to 8-day band-passed 200-hPa
u'v' transient eddy momentum fluxes are characterized by
increased (decreased) poleward momentum flux to the north
(south) of the mean storm track in the North Pacific, which
is consistent with the anomalous high in geopotential height
response (Plate 5c). Referring to the geopotential tendency
equation, the convergence of vorticity (or momentum) fluxes
north of the mean storm track is consistent with the posi-
tive equivalent barotropic height anomalies [
Lau and Nath
,
1991]. The significant precipitation anomalies (Plate 4) are
consistent with the weakening and northward displacement
of the North Pacific storm track (Plate 5).
3.3. Diagnosis of Forcing
One possible mechanism for the remote response over the
North Pacific involves a Rossby wave train (albeit weak in
this case) that is initially excited by diabatic heating anoma-
lies in the Arctic. This wave train propagates into the North
Pacific, where through interactions with the storm tracks, an
anomalous high is generated over the center of the basin.
This mechanism resembles the large-scale eddy feedback
described by
Peng
et al.
[2003] with the exception that the
boundary forcing was close to the storm track in their study.
Diabatic heating anomalies are constructed to investigate
the forcing of the atmosphere by reduced sea ice extent. The
Cntle mean vertically integrated diabatic heating is shown
by contours in Plate 6a and displays cooling of 50-100 W
m
-2
over the Arctic. The vertically integrated diabatic heat-
ing displays positive anomalies where Arctic sea ice is re-
duced of 15-25 W m
-2
, which is about 10-20% of mean.
There is a decrease in the region of the North Pacific storm
track (Plate 6a) A vertical cross section through the largest
diabatic heating anomalies indicates that in the Arctic the
positive heating anomalies are located below 800 hPa, and
the negative anomalies in the North Pacific penetrate up to
400 hPa (Plate 6b).
The linear baroclinic model described in section 2 was
forced with the transient eddy vorticity fluxes, transient eddy
heat fluxes, and mean diabatic heating separately to diagnose
the key forcing behind the atmospheric response patterns.
The LBM response (Plates 7c-7h) is compared to the full
GCM anomalies (Plates 7a and 7b) at 500 and 950 hPa. This
diagnostic model analysis reveals that the transient eddy vor-
ticity fluxes are responsible for maintaining the anomalous
high in the North Pacific, whereas transient eddy heat fluxes
and diabatic heating yield a negligible response. The LBM
response to the total transient eddy and diabatic heating is
nearly indistinguishable from the response to the transient
eddy vorticity fluxes. The primary role of transient eddy vor-
ticity fluxes has been noted in previous studies [
Peng
and
Whitaker
, 1999;
Deser
et al.
, 2007]. The LBM analysis does
not reveal how the reduced Arctic ice anomalies induced the
eddy momentum fluxes over the North Pacific, perhaps in-
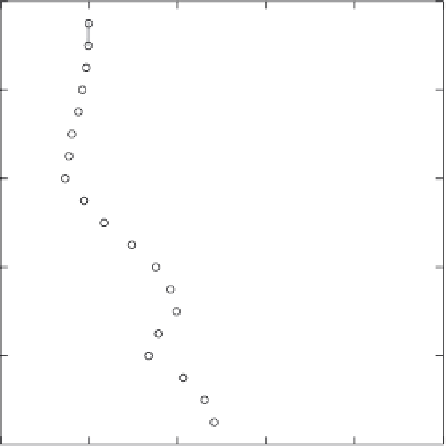
Figure 2.
August meridional moisture transport in units of g kg
-1
m s
-1
. Vertical profiles are shown at 70°N for Cntle (black lines)
and Sum95e (grey). Zonal averages over all longitudes (0°-360°)
are shown by the lines with no circles. Averages over the Pacific
sector (160°-200°E) are displayed by the lines with circles.


Search WWH ::

Custom Search