Information Technology Reference
In-Depth Information
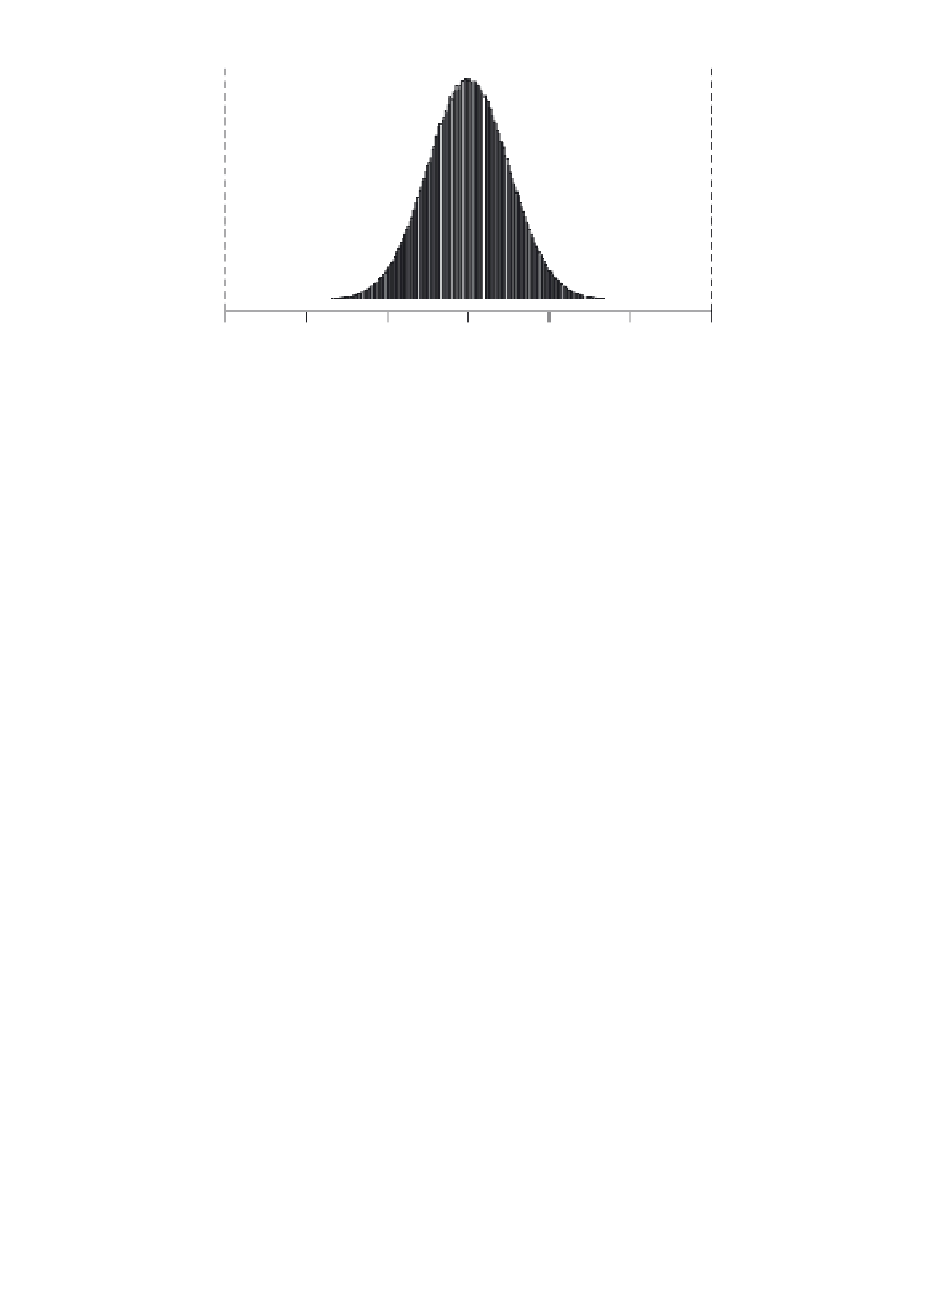
LSL
USL
-6
σ
+6
σ
-6
-4
-2
0
2
4
6
FIGURE 7.9
Highly capable pocess.
deviation. If the process cannot be measured in real numbers, then we convert the
pass/fail, good/bad (discrete) into a yield and then convert the yield into a sigma
value. Several transformations from discrete distributions to continuous distribution
can be borrowed from mathematical statistics.
If the process follows a normal probability distribution, 99.73 % of the values will
fall between the
±
3
σ
limits, where
σ
is the standard deviation, and only 0.27 % will
be outside of the
±
3
σ
limits. Because the process limits extend from -3
σ
to
+
3
σ
,
the total spread amounts to 6
total variation. This total spread is the process spread
and is used to measure the range of process variability.
For any process performance metrics, usually there are some performance speci-
fication limits. These limits may be single sided or two sided. For the A/P process,
the specification limit may be no less than 95 % accuracy. For receipt of material
into a plant, it may be two days early and zero days late. For a call center, we may
want the phone conversation to take between two minutes and four minutes. For each
of the last two double-sided specifications, they also can be stated as a target and as
a tolerance. The material receipt could be one-day early
σ
±
1 day, and for the phone
conversation, it could be three minutes
1 minute.
If we compare the process spread with the specification spread, we can usually
observe three conditions:
±
Condition I: Highly Capable Process (see Figure 7.9). The process spread is
well within the specification spread.
6
σ<
(USL
−
LSL)
The process is capable because it is extremely unlikely that it will yield
unacceptable performance.


Search WWH ::

Custom Search