Information Technology Reference
In-Depth Information
TABLE 6.1
Common Probability Distributions
(Continued)
0.5
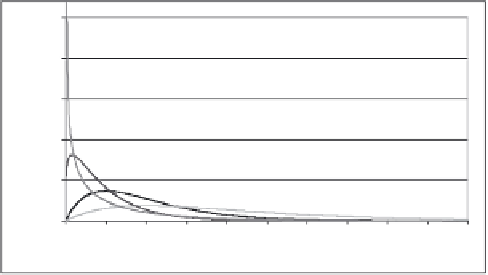
Triangular distribution:
a
= 2,
b
= 9,
c
= 4
⎧
2(
x
-
a
)
, if
axc
≤≤
=
⎪
(
b
-
a
)(
c
-
a
)
0.25
f
(
x
)
Tria
2(
b
-
x
)
, if
c < x
≤
b
⎩
(
b
-
a
)(
b
-
c
)
0
0
1
2
3
4
5
6
7
8
9
10
x
2.5
Gamma distribution:
2
λ
k
−
1
−
λ
x
f
(
x
)
=
λ
x
e
k
=0.5, λ=2
Gamma
1.5
Γ
(
λ
)
1
k
=1.2, λ=1.25
k
=2, λ=1
Failure from repetitive
disturbances
Duration of a multiphase task
0.5
k
=2, λ=0.5
0
0
1
2
3
4
5
6
7
8
9
10
x
cost-effective platform for running experimental design, what-if analysis, and op-
timization methods. Using the results obtained, software design teams can draw
better inferences about the code behavior, compare multiple design alternatives, and
optimize the metric performance.
Along with statistical and analytical methods, a practical sense of the underlying
assumptions can assist greatly the analysis activity. Statistical techniques often lead
to arriving at accurate analysis and clear conclusions. Several statistical methods
skills are coupled together to facilitate the analysis of software developmental and
operational metrics.
This chapter provides a survey of basic quantitative and statistical techniques that
have demonstrated wide applicability in software design. The chapter includes exam-
ples of actual applications of these techniques. Table 6.2 summarizes the statistical
methods and the modeling skills that are essential at each one of the major statistical
modeling activities.
Statistical analysis in design focuses on measuring and analyzing certain metric
output variables. A variable, or in DFSS terminology, a critical-to-quality (CTQ)
characteristic, is any measured characteristic or attribute that differs from one code
to another or from one application to another.


Search WWH ::

Custom Search