Information Technology Reference
In-Depth Information
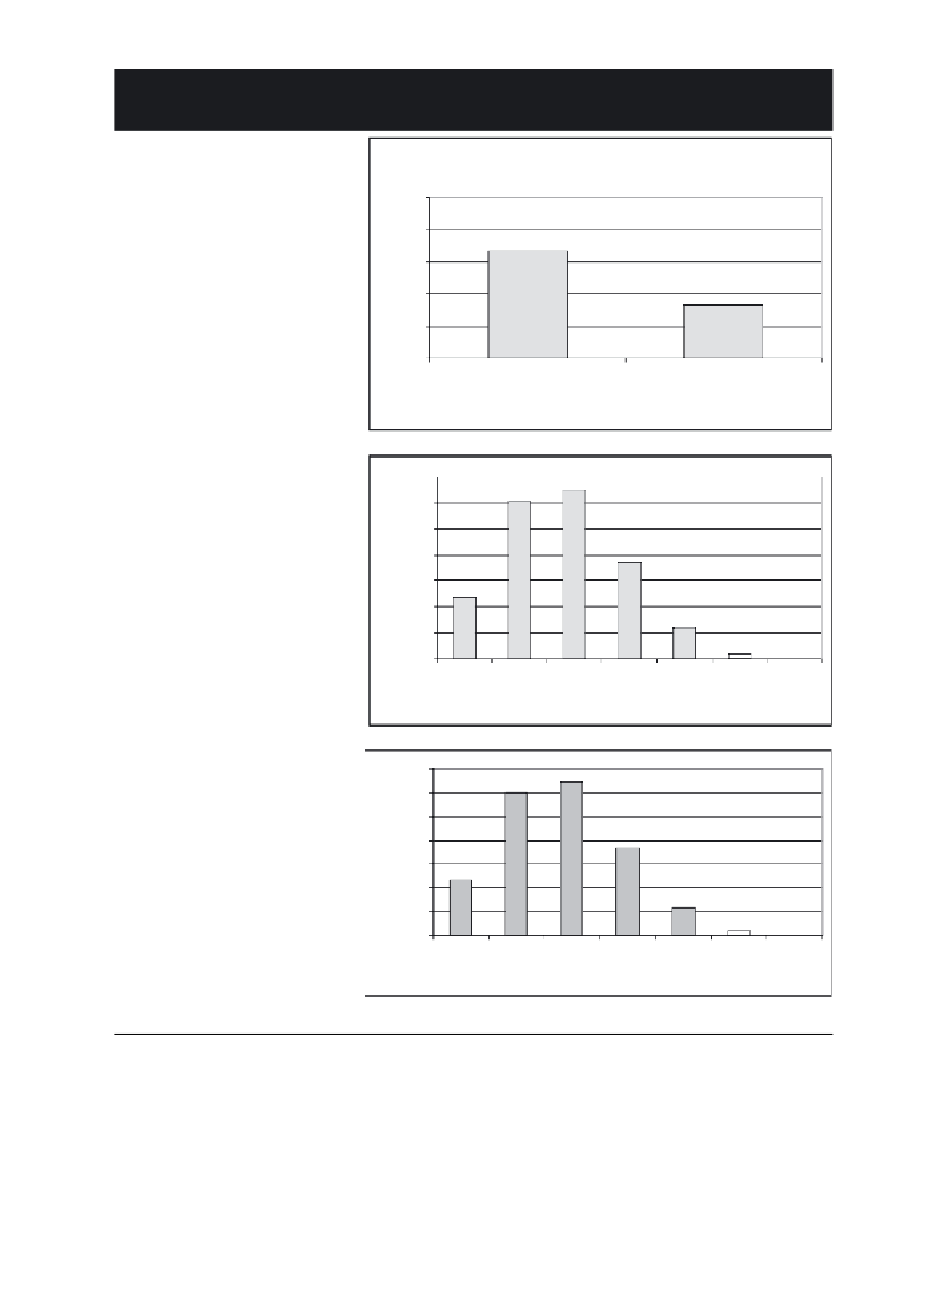
TABLE 6.1
Common Probability Distributions
Density Function
Graph
Bernoulli distribution:
1
1-
p
,
i f
x
=0
⎧
⎨
⎩
0.8
p
(
x
)=
p
,
i f
x
=1
0.6
0,
otherwise
0.4
0.2
Generalized random experiment
two
Outcomes
0
0
1
x
0.35
Binomial distribution:
0.3
0.25
n
⎛⎞
⎜
⎝⎠
0.2
x
n
-
x
p
(
x
)=
p
(1 −
p
)
x
0.15
0.1
Number of successes in
n
experiments (number of
defective items in a batch)
0.05
0
0
1
2
3
4
5
6
x
Poisson distribution:
0.35
0.3
-
λ
x
e
p
(
x
) =
x
= 0,1,...
λ
,
0.25
x
!
0.2
0.15
0.1
Stochastic arrival processes
0.05
λ
: average number of
arrivals per time unit
0
0
1
2
3
4
5
6
x
(Continued)


Search WWH ::

Custom Search