Biomedical Engineering Reference
In-Depth Information
4
0
c
a
b
-4
0
1000
Displacement (nm)
2000
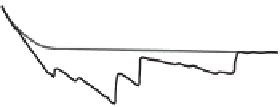
Fig. 3.16. An example of real force spectroscopy data: curves measured on
M. xanthus
cells. The red
trace is the approach, and the blue is the retract curve. Reproduced with permission from [164].
Copyright 2005 National Academy of Sciences, USA.
unfolding, only very weak bonds are broken, so there are only small vertical deviations in
the trace. At b, the probe applied sufficient force to break the bonds, as the molecule
breaks away from the receptor. Note that at this point, a single vertical movement may be
expected, but the step is staggered, indicating that multiple bonds are broken, and only at
point c is the tip finally free of molecules linking it to the cell surface. In a case such as
this, it is necessary to decide if the vertical distance (i.e. the force of adhesion), seen at
point b, represents the adhesion of one molecule, that of two molecules, or of an unknown
number. This is why it is difficult to automate data analysis in force spectroscopy, and this
combined with the typical requirement to collect hundreds of data points, means data
processing for such experiments can be very time-consuming. Some ways to improve the
situation include reducing the chance of multiple interactions in the first place by for
example spacing the grafted molecules out on the tip, or looking for multiples of single
forces in the 'spectrum' of forces measured [144].
It can be useful to perform force spectroscopy in a grid-like pattern over the sample,
leading to the possibility to locate specific chemical groups on a sample surface [146, 160,
165]. It is important, however, to remember that even highly specific measurements like
adhesion-force interactions, may be affected by sample topography [159]. In this mode,
force spectroscopy is sometimes termed chemical force microscopy [166]. A major
application of force spectroscopy is protein unfolding, which uses the AFM force sensi-
tivity to probe mechanical unfolding of large protein molecules, a biologically important
process, which is covered in Section 7.3.5.1.
3.2.2 Nanoindentation
If instead of measuring the data as the AFM withdraws from the sample surface, we
record the data measured as the tip contacts with and presses onto the sample surface, we
are carrying out a different experiment, called nanoindentation. Another technique
known as nanoindentation exists [167], which uses a dedicated machine to measure
load-displacement curves as a hard indenter (for example diamond) presses into a
sample. Typically, such instruments are designed to create a series of indents (holes)
in a sample, and allow the measurement of the sizes of the indents (by, e.g. light
microscopy), and are sensitive to forces in the micronewton range. By carrying out an