Biomedical Engineering Reference
In-Depth Information
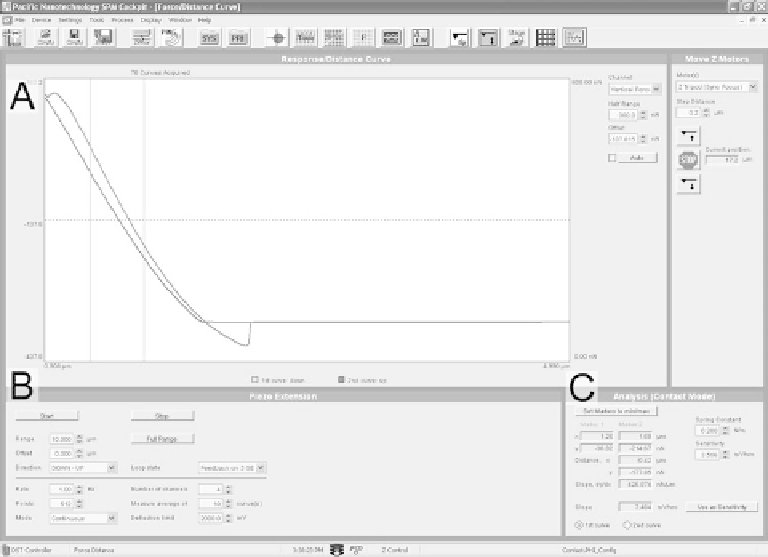
Fig. 2.26. Software windows used for measuring force/distance curves with the AFM. The main
window shows the curves acquired (A), the window below it allows the entry of acquisition
parameters (B), and to the right of this window are settings for extracting data from the curves (C).
is used to generate a force-distance curve. The end point of the force curve might be
defined by the user as a certain distance from the start point, or as a certain value of
cantilever deflection. The latter option allows the user to effectively define the maximum
force applied. Software for making F-D curves, illustrated in Figure 2.26, has several
variable parameters including:
(a) start and end position for probe;
(b) rate of probe approach motion;
(c) number of F/D curves to signal average;
(d) location on image for F/D curve.
Typically, the AFM software will also allow the user to collect a series of F/D curves in a
grid pattern over a user defined area of the sample surface, thus enabling measurement of
the tip-sample interaction across the sample surface. This facility may be termed layered
imaging, volume spectroscopy or force volume imaging.
An optical lever-based AFM force sensor requires a cantilever with a probe at its end for
operation. Typically these are fabricated using MEMS technology and are considered a