Biomedical Engineering Reference
In-Depth Information
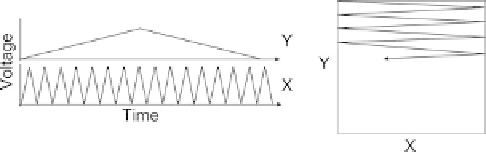
Fig. 2.22. The way the
x
and
y
piezoelectric elements are driven by varying potentials. Left:
illustration of the signals output for driving the
x
and
y
piezoelectrics in the AFM scanner. Right:
the motion of the probe in the
x
and
y
axis when the piezoelectric ceramics are activated.
with a 100
m scan range we would like to have 1 nm resolution, we do not require that
resolution over the whole range, but rather it's required in small section of the possible
range (for example a 512
m of the range). As an
alternative, a DAC with a much higher number of bits may be used. Note the inclusion of
circuits for scale and offset in the AFM electronics in Figure 2.21.
512 pixel region covering only 1
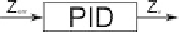
2.3.2 Feedback control circuit
In the AFM, the feedback control electronics take an input from the force sensor and
compare the signal to a set-point value; the error signal is then sent through a feedback
controller. The output of the feedback controller then drives the
Z
piezoelectric
ceramic. The type of feedback control used in AFMs is called a proportional-inte-
gral-derivative controller (PID). The equation governing the way this operates is shown
in Figure 2.23.
The proportional-integral-derivative controller takes the error signal and processes it as
follows: By selecting the appropriate P, I and D terms in Equation 2.6, the probe will
'track' the surface as it is scanned, keeping
Z
err
minimal. The integral term facilitates the
probe moving over large surface features and the P and D terms allow the probe to follow
the smaller, high-frequency features on a surface. Many AFM instruments actually use a
PI controller, as the derivative term is not used, although by convention the controller is
still referred to as a PID controller. Here, we follow this convention. The two signals from
the feedback loop that are typically digitized to create AFM images are the error signal and
the
z
voltage. The
z
voltage (converted using the instrument calibration to distance) forms
the 'height' or 'topography' image. The use of the error signal is described more thor-
oughly in Chapters 3 and 4 but most importantly, it is used by the instrument operator to
optimize scanning the parameters, including P, I and D values. When the PID parameters
are optimized, the error signal image will be minimal. Section 4.2 describes the process for
optimizing the PID parameters in an AFM. Implementation of the
z
feedback loop in an
AFM can be made with either analogue or digital electronics. The advantage of digital
ð
Z
err
dt
dZ
err
dt
Z
v
¼
P
V
err
þ
I
þ
D
ð
2
:
6
Þ
Fig. 2.23. Proportional-Integral-Derivative (PID) controller operation and equation.