Biomedical Engineering Reference
In-Depth Information
0.4
0.3
0.2
0.1
0
0
10
20 30
Height / nm
40
50
28
26
24
22
20
18
2
4
6
8
10
12
Image number
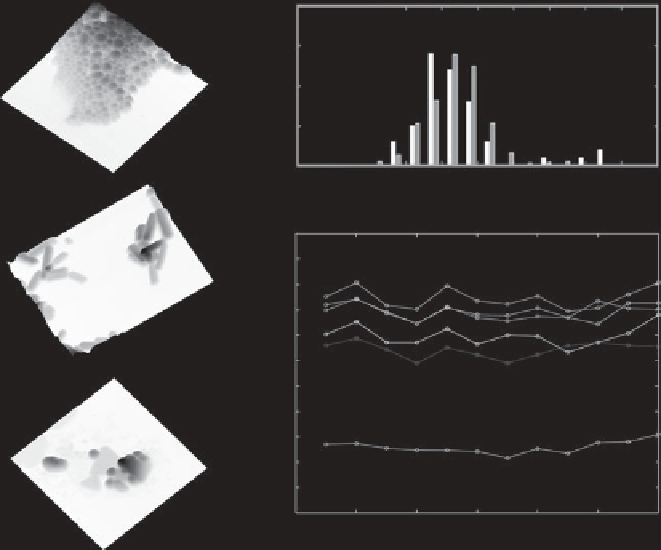
Fig. 7.11. Examples of nanoparticle imaging. Left: example images of nanoparticles with differ-
ent morphologies; from top: spheres, nanorods [284] and nanotriangles. Right: results from
imaging of gold nanospheres. Top: comparison of AFM height measurements (grey) with TEM
diameters (black). Bottom: illustration of effect of repeated scanning on apparent height of
individual nanoparticles. Each particle was measured 12 times with no apparent change in height.
Adapted with permission from [290]. Copyright (2008) Wiley, reprinted with permission of John
Wiley & Sons, Inc.
suspension onto freshly cleaved mica, allow it to dry, and image it. The imaging can
be carried out in contact, non-contact or intermittent-contact mode, although in some
circumstances contact mode may require more care to avoid sweeping effects. The
analysis can then be carried out manually or automatically, although in the authors'
experience and as reported elsewhere [290], a 'semi-automated' routine works best, i.e.
the analyst identifies the particles, and the software routine measures them. This avoids
user-dependent analysis, but allows the removal of other features, such as aggregated
particles and detritus which can affect the results. More details about sample preparation
for nanoparticle analysis are given in Section 4.1, and the image analysis of particles
samples is covered in Section 5.3.
7.2.2 Mechanical measurement of nanotubes
In addition to their electronic and optical properties, the mechanical properties of pseudo-
one-dimensional (1-D) materials such as nanotubes, nanowires, nanorods, nano belts, etc.
are the subject of great interest. This is because it has been found that many mechanical