Biomedical Engineering Reference
In-Depth Information
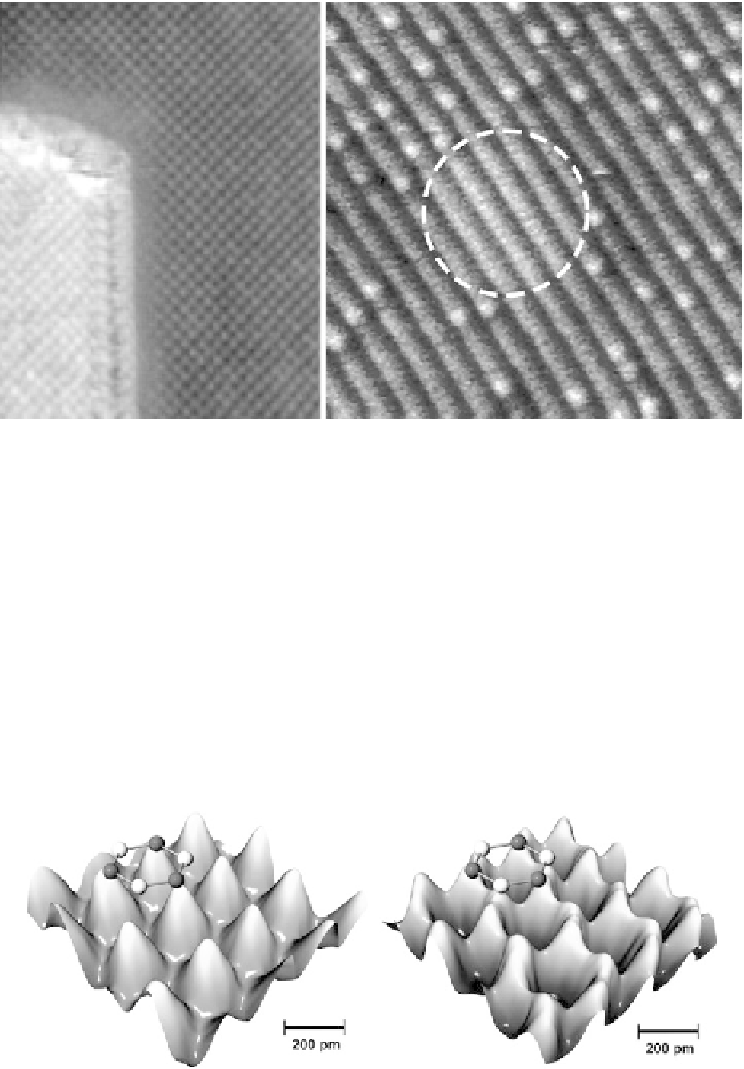
Fig. 7.6. Some examples of true atomic resolution with AFM Left: NaCl islands on a KBr substrate.
The interface between the two materials shows artefacts due to convolution with the tip profile.
Right: TiO
2
surface. The light rows are O atoms, while the darks rows contain the Ti atoms, and the
light dots are OH groups. The dashed circle shows an area of apparently greater height; this is
thought to be a patch of charge on the surface. Both images were taken by non-contact AFM in
vacuum. Adapted with permission from [433] and [432], both figures copyright (2007) by the
American Physical Society.
The experiment was carried out using a custom built instrument that allowed simultaneous
measurement by STM and AFM. In order to achieve these impressive results, the experiment
was a carried out under UHV, and at low temperature. Simultaneous AFM and STM measure-
ments made using this technique are shown in Figure 7.7. In this case, atomic-resolution AFM
was able to give a more accurate representation of the atomic structure than STM was.
Fig. 7.7. Simultaneously acquired atomic-resolution STM and AFM images of HOPG. Left: STM
image with overlaid model of graphite unit cell. Only the
atoms appear. Right: non-contact AFM
image obtained of the same region, showing that by this technique all atoms are revealed. Adapted
with permission from [428], copyright (2003) National Academy of Sciences, U.S.A.