Biomedical Engineering Reference
In-Depth Information
200
RTV11 Feature
RTV11 Flat
Steel
100
0
-500
0
1000
2000
Distance / nm
Topography
Indentation
Max Topo : 1361.2 nm
Min Topo : 0 nm
Max Indent : 620 nm
Min Indent : 0 nm
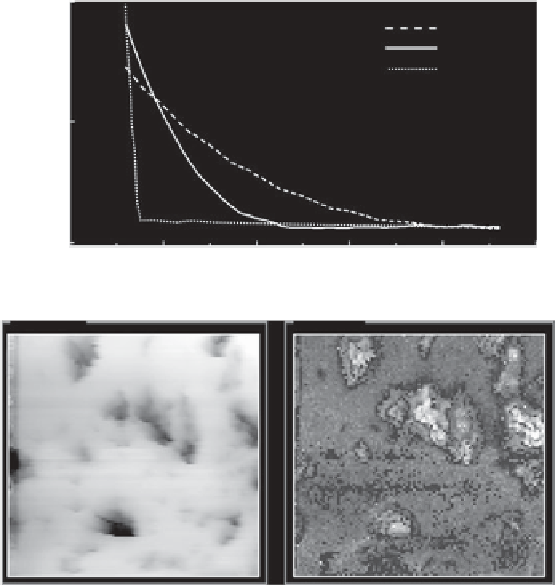
Fig. 7.4. Examples of nanoindentation experiments on a heterogeneous polymer surface. The
sample is RTV11, a silicone polymer with calcium carbonate filler particles. The upper graphs
show force-distance curves on a flat and a raised region of the RTV11, along with a steel surface for
comparison. Below are shown how these experiments may be made in a spatially resolved way. Both
topography and indentation images were derived from a map of force-distance curves acquired in a
10
m square area of the polymer surface. The correlation between the white protruding features in
the topography and dark, hard features in the indentation map suggest that these features correspond
to the hard filler particles [158].
were made of the polymer surface via a force-curve mapping routine. This technique
acquires force curves at user-defined spatial intervals over a user-defined area of the
surface. In this case, 100
m square area, i.e.
curves were acquired every 100 nm. Note that even at this low resolution, such an
experiment can be quite lengthy - if curves were acquired at 1 Hz, the 10,000 curves
would require almost three hours to record. Examples of the force curves obtained are
shown in Figure 7.4. It can be seen that there was considerable heterogeneity on the data
from different parts of the sample surface. In particular, when measuring curves over the
raised features seen on the surface, they were shown to be considerably stiffer than the
surrounding polymer matrix, as is seen in the image of indentation distance (Figure 7.4,
bottom right). Interestingly, a softer region seems to surround each hard particle, possibly
indicating some problems at the matrix-filler interface. These softer interphase domains
100 curves were acquired over a 10