Biomedical Engineering Reference
In-Depth Information
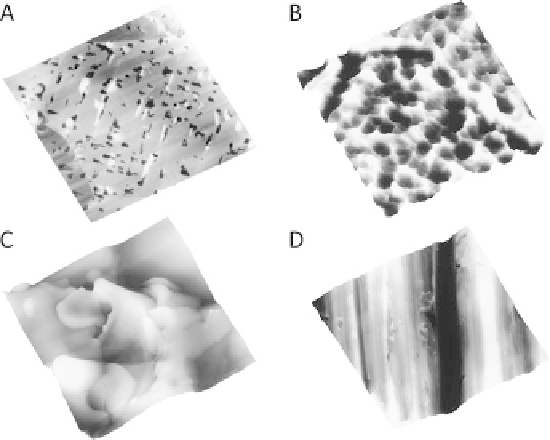
Fig. 7.2. AFM height images of titanium surfaces subjected to various treatments. Samples were
treated by A: polishing with colloidal silica, B: polishing followed by acid etching, C: sandblasting
then treating with air plasma, and D: grinding with silicon carbide paper. Adapted with permission
from [411]. All images have an
X-Y
scale of 20
20
m, and a
z
scale of 6
m.
measure with AFM, due to the fact that AFM produces high contrast on relatively flat
surfaces, and produces three-dimensional, digital data by default. In contrast, scanning
electron microscopy often gives the impression that surfaces with roughness values less
than 10 nanometres are extremely smooth and featureless, due to the fact that SEM detects
electrons scattered from a few nanometres into the surface. On the other hand, optical
techniques are limited in resolution, and require opaque surfaces. AFM has no such
restrictions in terms of samples, and gives accurate values for surfaces with roughness
down to the level of atomic flatness. In addition, neither SEM nor optical microscopy can
directly supply data suitable to measure roughness parameters, but determining roughness
parameters from AFM data is extremely simple. Therefore, AFM has become the method
of choice to measure nanoscale roughness, and is routinely applied to determine roughness
of metals and metal oxides [406], semiconductors [407], polymers [408], composite
materials [158], ceramics [409], and even biological materials [398, 410].
An example of the use of such measurements is the imaging of titanium, one of the
most commonly used materials for many medical implants. Because of its technological
importance, and because the surface texture and roughness of the implant is very
important for its performance, there have been many studies of titanium and titanium
oxide surfaces by AFM [366, 406, 411-414]. For example, in the study by Cacciafesta
et al
., a series of titanium surfaces with different treatments were compared by AFM
[411]. Some example images, of these surfaces are shown in Figure 7.2. The results
showed that roughness varied enormously with surface treatment. Clearly, examination
of the images shown in Figure 7.2 can give some important information on its own; for
example while the polished sample shown in Figure 7.2A displays many pits, it is