Biomedical Engineering Reference
In-Depth Information
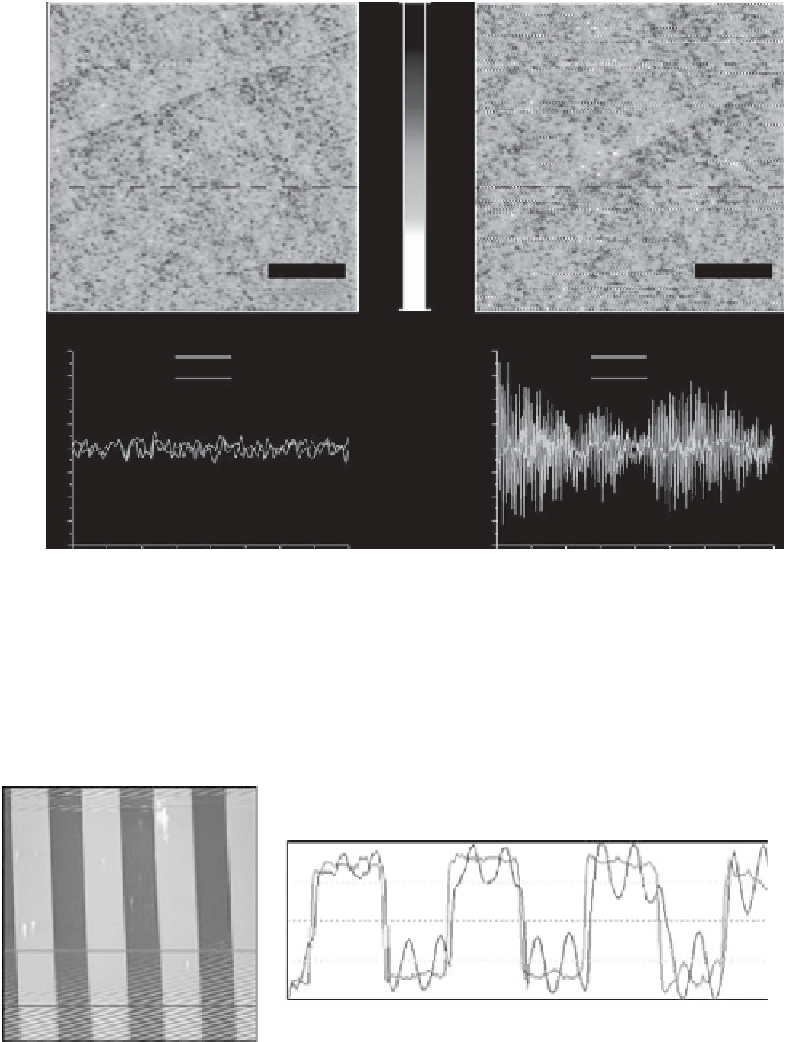
Recorded without talking
2 nm
Recorded while talking
Line 1
Line 1
Line 2
Line 2
1
µ
m
1
µ
m
0 nm
2.0
2.0
Line 1
Line 1
Line 2
1.5
1.5
Line 2
1.0
1.0
0.5
0.5
0.0
0.0
-0.5
-0.5
-1.0
-1.0
-1.5
-1.5
-2.0
-2.0
0
1000
2000
3000
4000
0
1000
2000
3000
4000
X
distance (nm)
X
distance (nm)
Fig. 6.16. Effect of acoustic noise. This high-z resolution image of a silicon wafer shows the effect
of acoustic noise on an image. Right: image and line profiles measured while acoustic noise was
present in the room. The acoustic vibrations from a person speaking while the image was acquired
are clearly visible in the line scans and the image. Left: image that was measured without the
acoustic noise. (A colour version of this illustration can be found in the plate section.)
Fig. 6.17. Example of electronic noise in an AFM image. This image of a test pattern has electronic
noise at the top and bottom of the scan. The electronic noise in this case was a result of not having a
ground wire attached to the stage. The artefact was identified by the oscillation frequency. (A colour
version of this illustration can be found in the plate section.)