Biomedical Engineering Reference
In-Depth Information
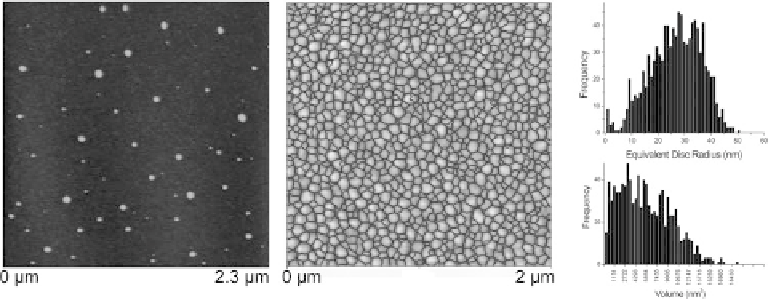
Fig. 5.11. Examples of (left) particle counting and (middle) grain analysis; in both cases the
automatically detected features are highlighted in red. On the right are shown some typical results -
histograms of grain volume and the radius of an equivalent disk. (A colour version of this illustration
can be found in the plate section.)
flooding until they meet. This typically gives far superior results in segmenting grain
images.
However it is carried out, once the segmentation is complete the AFM analysis software
measures particle or grain heights, widths, radius, areas and even volumes. Usually it is
possible to export all these measurements for further statistical analysis. The software
typically does not count 'partial' particles that are clipped at the edge of an image. Some
packages also allow direct calculation of the statistics (e.g. mean average, standard
deviation, etc.) and plotting of histograms of these parameters. Usually, the user would
like to combine the results from several images together to improve the number of
samples, so it is most convenient to export the data for consolidation and further analysis,
e.g. in a spreadsheet. Particle analysis routines can also be applied to measurements of pits
or depressions in a surface by simply inverting the image during the processing step. An
example of a grain/particle counting routine and the results are shown in Figure 5.11.
5.3.4 Fourier transform and autocorrelation analysis
In AFM image processing and analysis, a two-dimensional Fourier transform is an
operation that converts the AFM image from the spatial domain, into the frequency, or
more correctly, the wavelength domain. This is carried out by a mathematical operation
known as a fast Fourier transform, so is sometimes also known as FFT analysis. When
transformed into Fourier space, the image will show features in terms of wavelength (or
frequency). This is particularly useful to identify any repeating patterns in the image. For
example, the Fourier transform may be used to identify the frequency of noise in an image.
Most unwanted sources of noise have a characteristic frequency; once the frequency is
identified via FFT analysis, it is easier to identify the source of the noise and eliminate or
suppress it. The second major use of the Fourier transform in image analysis is to extract
useful data about the sample. This has been used for roughness analysis [370] and to
identify frequency characteristics of large features [371], but is probably most commonly