Biomedical Engineering Reference
In-Depth Information
500 nm
500 nm
0 nm
0 nm
300
300
200
200
100
100
0
0
0
5
10
15
0
5
10
15
x (
m
m)
x (
m
m)
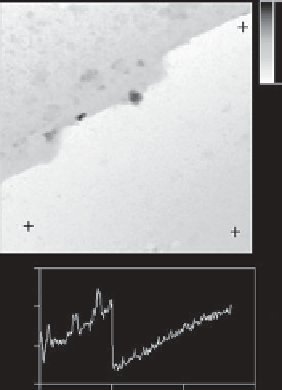
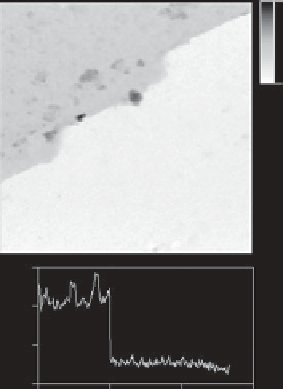
Fig. 5.2. Example of three-point plane levelling procedure. Left: result of plane-fitting to an image
of an area of a sample with two distinct levels. The global plane fit does not give a good result (see
the profile below), as it assumes the entire image is on the same plane. A global polynomial fit would
not work well either. Right: result of three-point plane fitting using the three points indicated by
crosses in the left image. The result is a much flatter background (see profile).
Exclusion of points from fit
Often AFM images show a few isolated features on a very flat surface. Typical examples
include nanoparticles, micro-organisms on glass slides, or individual molecules on mica.
With the most common type of levelling, polynomial line fitting, the presence of raised
features on the substrate will cause a levelling artefact. This occurs because the algorithm
fits the entire line, and sets it to the same level as all the other lines in the image. Thus,
where large features occur on a line, the substrate becomes artificially lowered, and the
image ends up with what look like 'shadows' or streaks behind any large features. Because
these 'streaks' change the height of the background, they make feature height measure-
ments inaccurate. This is quite a common artefact in processed AFM images, and many
examples of images poorly processed in this way have been published. However, the
problem is easily overcome by simply excluding certain regions from the fitting proced-
ure. Typically this is done by a routine where the user draws boxes around the regions to
exclude. In this way, only the real background will be used for the fitting, and correct
levelling can be achieved as is shown in the Figure 5.3. The only problem with this
technique is that it can be quite time-consuming. If there is more 'sample' than 'back-
ground' then it can be advantageous to use the software to select the areas to include in the
analysis, rather than those to exclude. That is, the user draws boxes only over the substrate,
rather than over the sample. In some cases (for example, a very dense sample of nano-
particles, or a sample with very irregular features), it can become extremely time-con-
suming and difficult to draw boxes around all the features in the image. In this case, some
software has an option to automatically include or exclude features based on their heights,