Biomedical Engineering Reference
In-Depth Information
deflection value, with some room for further deflection before the cantilever reaches the
surface. The set-point may be further reduced if necessary once on the surface. Once initial
parameters are chosen, and the probe is relatively close to the surface, an automated
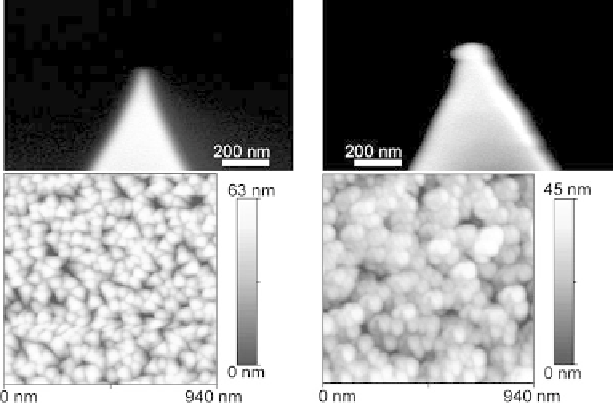
approach is carried out. Note that incorrect approach can easily damage a tip, an example
of which is given in Figure 4.5. Some instruments allow adjustment of the automatic
approach parameters, such as feedback values during approach, or approach speed. These
should be changed only with caution, as the kind of damage shown in Figure 4.5 can easily
result from using the wrong parameters.
4.2.3 Optimizing scan conditions
Optimizing the scanning parameters for the best possible image quality and most accurate
images is probably the most important step in AFM data acquisition. Often 'standard'
parameters are used initially for the approach, and such numbers might be provided by the
instrument's manufacturer. However, these values will rarely, if ever, be suitable to
obtained good images. The wide range of possible samples, scanning environments, and
even probe manufacturing differences means that different parameters are used for nearly
every scanning session. The method to optimize the parameters is an iterative one.
The parameters are changed in steps, one at a time, until the tip is properly following
the surface, and is giving a true image of the sample. Once the optimal parameters are
determined, if the sample is homogeneous, and the instrument stable, the optimized
parameters might be suitable for various images on the same sample. Changing to a
similar sample with the same probe usually means small adjustments are necessary,
again reached via an iterative procedure. Although it takes a while to fully master this
procedure, following the method outlined in this chapter will allow optimization of
scanning parameters in a few minutes.
Fig. 4.5. Examples of probe damage on approach. Left: SEM image of sharp probe and an AFM
image measured with the sharp probe. Right: SEM image of damaged probe and an AFM image
measured with the damaged probe on the same sample.