Environmental Engineering Reference
In-Depth Information
such as in the design of bridges and water con-
veyance structures, flood control planning, and
establishment of in-stream flow requirements
for aquatic ecosystems (Vogel and Fennessey,
1995
). Streamflow duration curves also can
be used to approximate base flow to streams.
Rutledge and Mesko (
1996
), for example, deter-
mined that a good estimate for base flow was
streamflow that was equal to or exceeded 42% of
the time for the Valley and Ridge Physiographic
Province of the eastern United States.
Flow duration curves for sites with stream-
flow data are calculated with mean daily flows
(weekly or monthly flows also can be used)
over a particular period of record. The curves
can be easily developed in a spreadsheet pro-
gram. Flow values are sorted from highest to
lowest, irrespective of date. A rank is given
to each value, starting with 1 for the highest
value and increasing sequentially to
N
for the
lowest, where
N
is the total number of data
points. The probability of exceedance,
Pr
, for
any discharge value can then be calculated
assuming a Weibull distribution (Helsel and
Hirsch,
2002
):
1000
03566000
100
07027500
10
03418070
1
0.1
03565040
0.01
0 02030405060708090100
Percent time equaled or exceeded
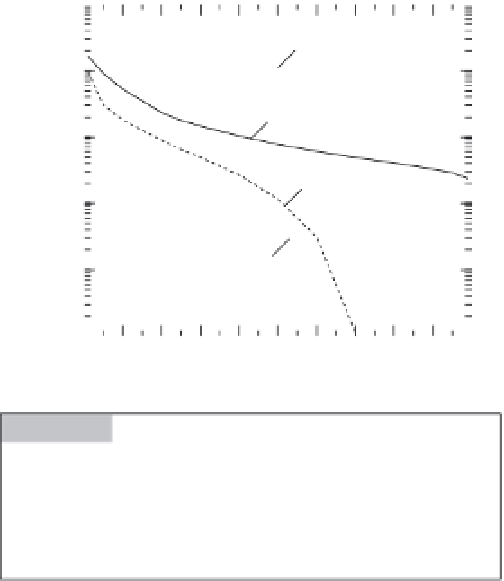
Figure 4.6
Streamflow duration curves for four gauged
sites in Tennessee: Hiwassee River at Charleston (USGS
station number 03566000, drainage area 5950 km
2
); South
Fork Forked Deer River at Jackson (07027500, 1280 km
2
);
Roaring River at Gainesboro (03418070, 544 km
2
); and
Chestuee Creek above Englewood (03565040, 38 km
2
).
(1280 km
2
) appear to be dominated by ground-
water discharge; slopes of the curves are low
and relatively uniform at exceedance probabil-
ities greater than about 40%. The flow duration
cur ve for the Hiwassee R iver (5950 km
2
) has the
lowest slope in
Figure 4.6
, a fact that could be
construed as indicating a substantial amount
of groundwater discharge; however, flow in
this stream is regulated with dams above the
gauge; therefore, it is not possible to infer any
information on groundwater discharge at this
site. The flow duration curve for the Roaring
R iver (5 4 4 k m
2
) has a steep slope indicating that
flow is dominated by surface runoff, probably
in response to storms of short duration. There
are many days of zero flow in this stream; thus,
little or no groundwater contribution would be
expected.
Direct association of streamflow duration
with base flow requires an independent esti-
mate of base flow. Nelms
et al
. (
1997
) applied a
streamflow hydrograph separation technique
(
Section 4.5.1
) to estimate base flow for 217 con-
tinuous-record streamflow gauging sites within
the state of Virginia. Mean annual base flow was
found to be well represented by
Q
50
for five dif-
ferent regions in the state (
Figure 4.7
). Studies
Pr
=× +
100
[
m
/(
N
1)]
(4.5)
where
Pr
is in percent of time and
m
is rank of
the discharge value of interest. Streamflow is
usually plotted against
Pr
on a log-linear scale to
provide detail on the low-flow end of the curve.
Q
Pr
designates streamflow equaled or exceeded
Pr
percent of the time; it can be read directly
from the duration curve (
Figure 4.6
). Flow dur-
ation curves are often normalized by dividing
flow rates by drainage area.
Qualitative information can be gleaned
from the shape of a streamflow duration
curve. Steep slopes in any section of a curve
indicate high variability in flow; most likely
these streams are dominated by surface flow.
Groundwater flow is generally more uniform
over time than surface-water flow (although
groundwater discharge rates can indeed vary
throughout the year). Low slopes in the low-
flow section of the curve generally indicate
groundwater discharge. As shown in
Figure
4.6
, flows in Chestuee Creek (drainage area
of 38 km
2
) and South Fork Forked Deer River