Environmental Engineering Reference
In-Depth Information
Table 3.2. Annual average recharge estimated for three small watersheds in Puget Sound Lowlands,
Washington, by the Deep Percolation Model (DPM) and by the tritium mass balance method (Bauer and
Mastin,
1997
).
Watershed
DPM estimated
recharge (mm)
Ratio of DPM recharge to
precipitation
Recharge from tritium
mass balance (mm)
Clover
37
0.04
42-53
Beaver
13 8
0.14
10 4 -13 4
Vaughn
172
0.17
169 -20 0
300
Precipitation
Runoff
250
Evapotranspiration
Recharge
200
150
100
50
0
JASOND
JFMAMJ JASOND
JFMAMJ JAS
1991
1992
1993
Figure 3.7
Monthly water-budget components simulated
with the Deep Percolation Model during the study period
for the Vaughn catchment (after Bauer and Mastin,
1997
).
350
300
250
200
150
100
50
0
JASOND
JFMAMJ JASOND
JFMAMJ JAS
1991
1992
1993
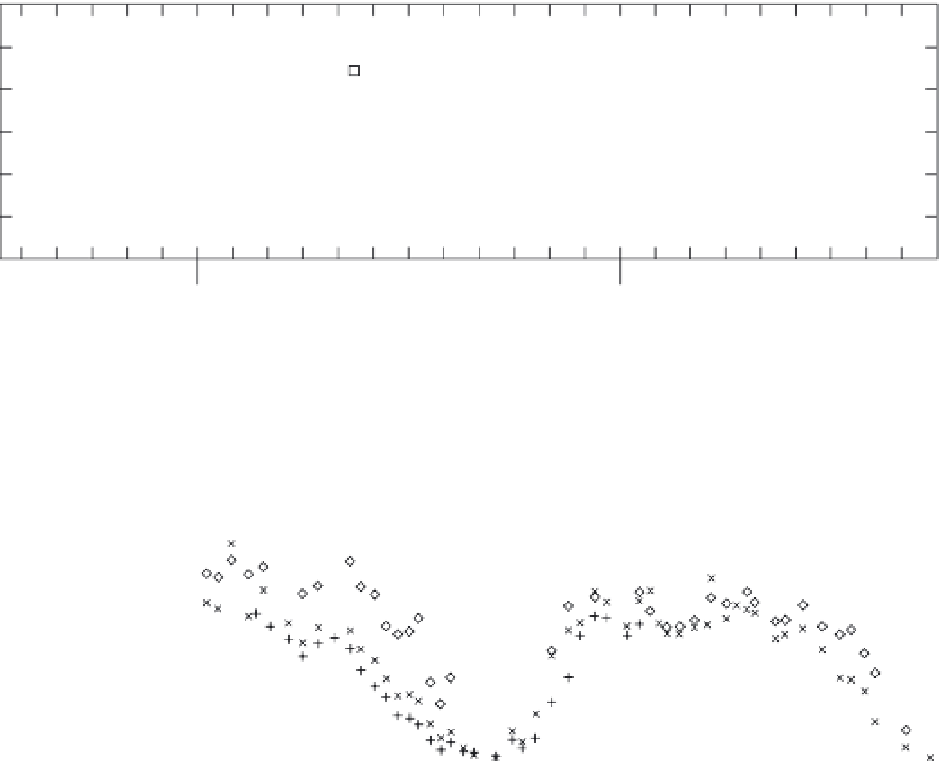
Figure 3.8
Observed (symbols) soil-water storage at
six locations and Deep Percolation Model simulated (line)
soil-water storage in millimeters above wilting point during
the study period for the Vaughn catchment (after Bauer
and Mastin,
1997
).
Example: Monavale catchment, Australia
Zhang
et al
. (
1999
) described the application of
the watershed model, TOPOG_IRM, for estimat-
ing recharge and changes in soil-water content
within the 161-ha Monavale catchment near
Wagga Wagga, New South Wales, Australia.
TOPOG_IRM is a physically based, distributed
parameter model that predicts water move-
ment
applying the tritium mass-balance method
(
Section 7.2.3
); these estimates were similar to
the DPM determined values (
Table 3.2
).
within
a
soil-vegetation-atmosphere