Environmental Engineering Reference
In-Depth Information
100
0
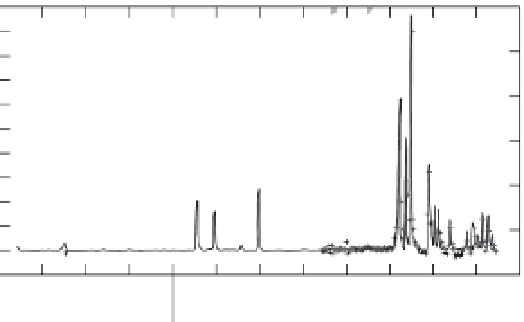
Figure 3.4
Measured daily
rainfall and estimated recharge by
the water-table fluctuation method
(+) and the water-budget transfer-
function model (dark line) for a site
in west Orange County, Florida
(after O'Reilly,
2004
).
90
50
80
70
100
60
50
150
40
30
200
20
10
250
0
-10
300
1993
1994
daily recharge rates estimated with WBTF and
those calculated by using the water-table fluctu-
ation method (
Section 6.2
) on the basis of meas-
ured groundwater levels. Simulated recharge
rates were in good agreement with estimates from
the water-table fluctuation method (
Figure 3.4
).
If daily precipitation and actual evapotranspir-
ation data are available, the WBTF model is easy
to use and can be readily applied to multiple sites
within a watershed by using a GIS. The need for
calibration of transfer-function models at every
application site remains an unresolved question.
O'Reilly (
2004
) provides estimates of the WBTF
model parameters for variable soil textures and
water-table depths.
direction,
K
r
is relative hydraulic conductivity,
h
is pressure head,
H
is total head,
Q'
accounts
for sources and sinks,
t
is time, and
z
is the ver-
tical coordinate. Models based on the Richards
equation are sometimes used in the transport
phase of soil water-budget models, but they are
actually self-contained water-budget and trans-
port models. The Richards equation is, after
all, a statement of a water budget. The land
surface, unsaturated zone, and saturated zone
are treated as a continuum through which
water is allowed to move upward as well as
downward. These models have capabilities of
allowing water for evapotranspiration to be
withdrawn at any depth and allowing the loca-
tions of the zero-flux plane and the water table
to fluctuate.
Application of a Richards equation-based
model requires data on water content as a func-
tion of pressure head (the water-retention curve)
and relative hydraulic conductivity as a func-
tion of pressure head (the unsaturated hydraulic
conductivity curve). These curves can be deter-
mined in the field or in the laboratory (
Section
5.2
), but measurements are expensive and time
consuming (Dane and Topp,
2002
). Empirical
equations, such as those of van Genuchten (
1980
)
and Brooks and Corey (
1964
), have been derived
to represent these curves. Use of these equa-
tions with parameters that have been developed
for generic soil types provides an alternative
to direct measurements of the curves. The van
Genuchten equations are given by:
3.3.2 Models based on the Richards
equation
Flow models based on the Richards equation,
such as VS2DI (Hsieh
et al
.,
1999
), HYDRUS
(Simunek
et al
.,
1999
), and UNSAT-H (Fayer,
2000
), provide a physically based approach for
simulating water movement through the unsat-
urated zone. Estimates of travel times for wet-
ting fronts moving from the soil zone to the
water table can be generated, and physical fea-
tures that affect water movement can be iden-
tified. The Richards equation is derived from
a water conservation equation and the Darcy
equation; it can be written for one-dimensional
vertical flow as:
∂ ∂ =∂
/
t
KK h H
()
∂ ∂ +
/
z
2
Q
'
(3.4)
sr
where θ is volumetric water content,
K
s
i
s sat-
urated hydraulic conductivity in the vertical
θ θθ α θ
( ) = (
h
−
)[1 + (
h
) ]
+
(3.5)
n
-m
s
r
r