Environmental Engineering Reference
In-Depth Information
N
Discharge
Area
Streambed
Te mperature (°C)
10 to 13
13 to 14
Discharge
Area
14 to 15
Discharge
Area
15 to 16
Low-flow
Band
16 to 17
0
5
10 Meters
17 to 19
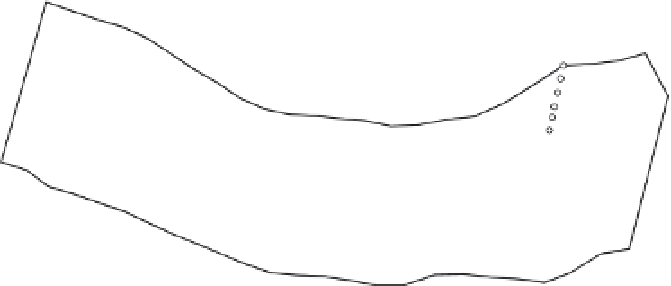
Figure 8.8
Map of measured streambed temperatures in
Pine River at the 0.2 m depth, July 28 and 29, 1998 (Conant,
2004
, Figure 5A,
Ground Water
, Wiley-Blackwell).
N
Discharge
Area
Vertical Flux (L/m
2
d)
-25 to 0
Discharge
Area
0 to 50
50 to 100
Discharge
Area
Low-flow
Band
100 to 200
0
5
10 Meters
200 to 587
points over a 60 m reach of the Pine River in
Angus, Ontario, Canada, to investigate vari-
ability of streambed temperatures and fluxes.
Temperatures varied over a range of almost 10°C
for measurements made in July 1998 (
Figure 8.8
).
The river is primarily a gaining stream over
this reach. Rates of vertical exchange between
groundwater and the stream were calculated
with the Darcy method for the 34 locations
on the grid where piezometers were installed.
Hydraulic conductivity was determined from
slug tests. A regression equation was developed
to relate estimated fluxes to measured streambed
temperatures. The regression equation was then
used to estimate vertical fluxes at all points on
the temperature grid (
Figure 8.9
). Fluxes varied
Figure 8.9
Map of calculated vertical fluxes across Pine
River streambed, July 28 and 29, 1998; positive values
indicate groundwater discharge to the river (Conant,
2004
;
Figure 8A,
Ground Water
, Wiley-Blackwell).
A vertical hydraulic conductivity value of
0.56 m/day produced simulated results shown
in
Figure 8.7
. The calculated infiltration rate
was 0.46 m/day, which is close to the value cal-
culated with a stream water-budget method
(Prudic
et al
.,
2007
).
Example: Pine River, Angus, Ontario,
Canada
Conant (
2004
) measured streambed tempera-
ture at a depth of 0.2 m on a grid of about 400