Environmental Engineering Reference
In-Depth Information
attention (Healy and Cook,
2002
). Because of
the complexities of such systems, the validity
of applying the WTF method demands diligent
analysis. Porosities of igneous and metamorphic
rocks are often less than 1%, and even some
sandstones and limestones have total porosi-
ties of less than a few percent (de Marsily,
1986
).
Recharge to low porosity, fractured-rock aqui-
fers is often characterized by large variations
in groundwater levels. Bidaux and Drouge
(
1993
), for example, measured water-level rises
of approximately 15 m in response to rainfall
events of approximately 50 mm over 24 hours
in fractured Cretaceous limestones and marly
limestones in southern France.
In fractured-rock systems, the permeability
of the matrix is usually very low, so that a long
time is required for pores to fill and drain. The
fracturing of low-porosity formations creates
a total porosity distribution that is essentially
bimodal. Most recharge through the unsatur-
ated zone occurs rapidly along discrete, perme-
able fractures, which may become saturated
during rain events, even though surrounding
pores remain unsaturated. Thus, water levels in
fractures may rise while most of the formation
remains unsaturated (
Figure 6.7a
). In this case,
the specific yield would be equal to the fracture
porosity. This situation is most likely to occur in
response to large rainfall events where the mat-
rix permeability is very low, so the rate of water-
level rise would be very rapid, as would the
subsequent water-level decline (
Figure 6.7b
).
Some fractured-rock systems have deep water
tables that display only seasonal fluctuations;
water levels in fractures and matrix tend to rise
and fall together. In the case of a declining water
table, the time for the matrix to drain may be
extremely long. The aquifer matrix may supply
water as base flow to streams for many months
after the water table (as reflected in fractures
and piezometers) has declined (Price
et al
.,
2000
).
Hydrograph variations for piezometers
installed in fractured rocks often provide a
poor record of water-level variations within
the aquifer itself. This counterintuitive scen-
ario occurs where the permeability of the
aquifer is low and the storativity of the aqui-
fer is very low relative to the storativity of
(a)
(b)
3
Initial
1
2
Matrix
2
Matrix
1
3
Initial
Fractures
Fractures
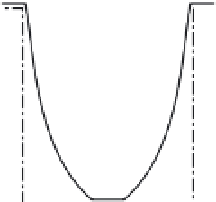
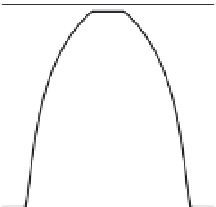
Figure 6.7
Diagrams of saturation of a fractured-rock
matrix under (a) rising and (b) falling water tables. Where
the rate of water-table rise is rapid relative to the matrix
permeability, the matrix remains unsaturated as the water
level in the fracture rises (1). The specific yield is equal
to the fracture porosity. Where the rate of water-level
rise is slow and the matrix permeability is high, the water
table rises evenly in both the fracture and matrix (3). More
usually, the matrix partially fills as the water table rises,
and the specific yield is between these two limiting values
(2). Congruent behavior occurs for declining water tables.
(With kind permission from Springer Science+Business
Media:
Hydrogeology Journal
, “Using groundwater levels to
estimate recharge”, v. 19, 2002, p. 101, R. W. Healy and
P. G. Cook, Figure 9.)
the piezometer or well. Simmons
et al
. (
1999
)
noted that short-term variations in aquifer
water level are substantially attenuated within
the well, particularly where the well radius is
large. The degree of attenuation increases as
the storativity of the aquifer decreases. Longer-
term variations in aquifer water level (such as
annual cycles) are less attenuated. This effect
sometimes manifests itself as very smooth
hydrographs in low-porosity aquifers, which
do not show responses to daily rainfall events,
except in extreme cases.
Fig u re 6.8
shows a well l
hydrograph from a piezometer completed in
the Mintaro Shale near Clare, South Australia.
At this site, the fracture porosity is estimated
to be about 10
-3
on the basis of outcrop map-
ping, and the matrix porosity is estimated
to be 0.01 to 0.05, from helium porosimetry.
The hydraulic conductivity of the matrix is
extremely low (<10
-12
m/s). The water table at
this site varies smoothly throughout the year;
most rainfall events do not produce measur-
able changes in water level in the piezometer.