Environmental Engineering Reference
In-Depth Information
Example: Western Australia
Seasonal variation in drainage through the
unsaturated zone at a site on the Gnangara
Mound, Western Australia, was studied from
1985 to 1987 by Sharma
et al
. (
1991
). The depth
to the water table was approximately 90 m,
and the unsaturated zone consisted mostly
of sand with occasional bands of clay. The
saturated hydraulic conductivity of the sand
was high (approximately 30 m/day); hence,
surface runoff was negligible. The subhumid
woodland receives about 775 mm of precipita-
tion annually. It was instrumented with rain
gauges, observation wells, and eight neutron
probe access tubes that penetrated to a depth
of 20 m. Water content was measured with a
neutron probe at 0.5 m depth intervals every
2 to 4 weeks.
Pressure heads within the unsaturated
zone were not directly measured in this study.
Water-retention curves (
Section 5.2.3
) were
determined in the lab and parameters of the
Brooks-Corey equation (Equation (
5.4
)) were cal-
culated. Pressure head,
h
, was then determined
from field-measured water contents as:
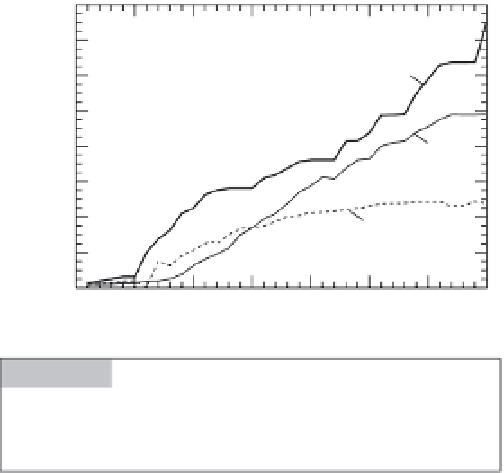
800
700
Rain
600
500
400
ET
300
200
Drainage
100
0
0
50
100
150
200
250
300
350
Julian date, 1989
Figure 5.7
Cumulative rainfall, drainage, and
evapotranspiration (ET) for 1989 at the Bicton College site
(Cooper
et al
.,
1990
; reprinted with permission of John
Wiley & Sons, Inc.).
in England (Cooper
et al
.,
1990
). These aqui-
fers together account for 60% of the country's
public groundwater supply. All sites contained
at least three neutron-probe access tubes, a
vertical profile of tensiometers extending to
a depth of 3 m, and a rain gauge. Monitoring
frequency of the instruments ranged from
one to five times per week. The length of data
record was between 2 and 5 years. The ZFP
method was used to estimate both recharge
and evapotranspiration.
Depth to the zero-flux plane increased
over the course of the summer of 1989 at the
Bicton College site (
Figure 5.6
). Most drain-
age occurred in late winter and spring, and,
for 1989, drainage was equivalent to 32% of
precipitation (
Figure 5.7
). Conditions were
not appropriate for application of the ZFP
method at the Bicton College site for about
45% of the year because of downward drain-
age throughout the soil column or tensiom-
eter failure. A water-budget method was used
to estimate drainage during those periods.
Averaging over all years and data-collection
sites, drainage was 27% of precipitation.
The ratio of drainage to precipitation varied
because of differences in hydraulic properties
of the subsurface materials at the sites and
the year-to-year variability in total amount,
timing, duration, and intensity of precipita-
tion (Cooper
et al
.,
1990
).
hh
=
/{( ( )
θ θθθ
1/
h
−
) /(
−
λ
)}
(5.12)
b
r
s
r
where variables are as defined for Equation (
5.4
).
The location of the ZFP at one access hole var-
ied from about 1 to 10 m in depth (
Figure 5.8
).
Drainage was estimated for two different depth
intervals: the ZFP to the 10 m depth and the ZFP
to the 18 m depth, referred to as the 10 m and
18 m drainage estimates, respectively. The two
estimates should be similar, but several factors
can contribute to differences. Heterogeneities,
such as a clay lens, can impart a horizontal com-
ponent to the flow field; there can be a long lag
from the time water passes the 10 m depth until
it reaches the 18 m depth; and there are inaccur-
acies in water-content measurements. For periods
when the entire profile was draining, Sharma
et al
. (
1991
) used the Darcy method in conjunction
with the assumption of a unit hydraulic gradient
(
Section 5.4
) to estimate drainage.
There was a strong seasonal trend in precipi-
tation, 80% falling between May and October.
The 10 m drainage estimates for boreholes 4