Environmental Engineering Reference
In-Depth Information
operation can be problematic, especially for
depths greater than about 2 m, although with
recent design advances, specialized tensiom-
eters can be installed through a borehole at any
depth within the unsaturated zone (Hubbell
and Sisson,
1998
). In some studies, duplicate ten-
siometers are installed at measurement depths
to ensure continuous data collection should one
of the instruments malfunction.
Other approaches for measuring pressure
heads in the unsaturated zone exist, but are not
widely used in ZFP or Darcy methods, mostly
because the range of pressure heads that they
are capable of measuring is in a drier range than
that of tensiometers. Heat dissipation probes
(HDPs) determine pressure head by measuring
the rate at which heat is dissipated within a
ceramic probe; that rate is dependent on ther-
mal conductivity of the ceramic, which varies
with water content in a predictable manner
(Scanlon
et al
.,
2002a
). Through calibration, the
heat dissipation rate can be converted to deter-
mine pressure head. The HDPs are small (about
30 mm in length) and can be installed through
boreholes. HDPs typically provide readings in
the range of -10 kPa to -1 MPa or -1 to -100 m
of water (Scanlon
et al
.,
2002a
). The accuracy of
each HDP can be assessed through laboratory
calibration; McMahon
et al
. (
2003
) estimated the
accuracy to be ±1 m. Thermocouple psychrom-
eters provide readings in the very dry range,
about 0 to -800 m (Andraski and Scanlon,
2002
);
the probes must be individually calibrated.
Other techniques for measuring pressure head
are discussed in Dane and Topp (
2002
). Pressure
head can also be inferred from measurements
of water content if the water-retention curve is
known (Sharma
et al
.,
1991
).
(a)
0.5
Sand
Silt loam
0.4
0.3
0.2
0.1
0
(b)
1×10
2
Sand
Silt loam
1
1×10
-2
1×10
-4
1×10
-6
1×10
-8
1×10
-10
1×10
-12
1×10
-14
0
-1
-2
-3
-4
-5
Pressure head (m)
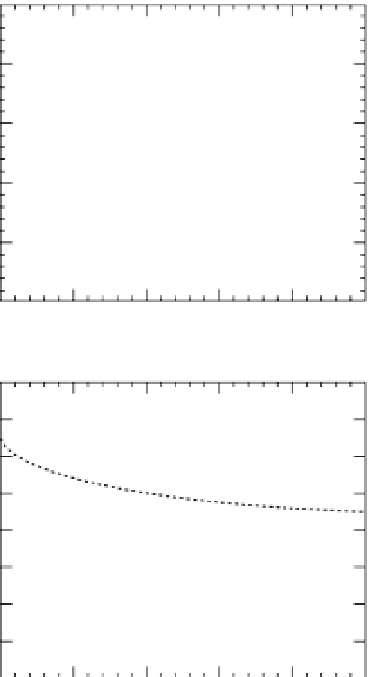
Figure 5.1
Water-retention (a) and hydraulic-
conductivity (b) curves for sand and silt loam. Curves
are described by the van Genuchten (
1980
) equations
(Equations (
5.2
) and (
5.3
)) with parameters as derived by
Carsel and Parrish (
1988
) (
Table 3.1
).
usually measured in the laboratory on small
cylindrical cores (typically 50 to 100 mm in
length and diameter) by using Tempe cell or
pressure-plate apparatus (Dane and Topp,
2002
).
The procedure is straightforward: a fixed pres-
sure is applied to the sample, and the sample
is allowed to drain. The water content of the
sample is determined by weighing the sample
once drainage ceases. The equivalent pressure
head and the measured water content consti-
tute a single point on the water-retention curve.
The procedure usually begins with a fully sat-
urated sample; the fixed pressures are altered
incrementally to produce the desired number
of points on the curve. A water-retention curve
can be measured beginning with a dry sample
5.2.3 Water-retention and hydraulic
conductivity curves
The water-retention curve displays the rela-
tion between soil-water content and pressure
head (
Fig ure 5.1a
). Water-retention curves are
strongly influenced by soil texture. Coarse-
grained sediments, such as sand, tend to drain
more easily (i.e. under higher pressure heads)
than fine-grained sediments, such as silt
loam (
Fig ure 5.1a
). Water-retention curves are