Agriculture Reference
In-Depth Information
1
0.9
0.8
0.7
0.6
0.5
0.4
0.3
0.2
0.1
0
Species c
Species b
Risk
Assessment
PAF
-3 -2 -1 0 1 2 3 4 5
Log Concentration (
g/l
-1
)
LC
50
/EC
50
/NOEC for dif. species
Species A
EQC HC
5
SSD
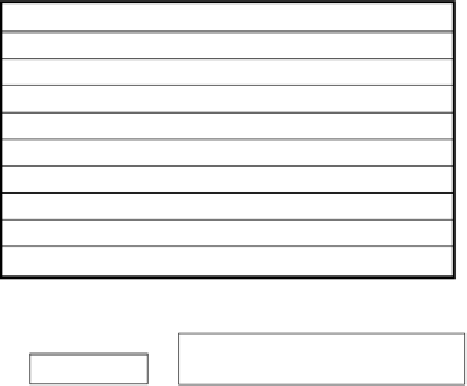
FIGURE 16.2
The species sensitivity distribution (SSD). The dots show the data for the different species.
Forward use (from the log concentration to the
-axis) yields the potentially affected fraction (PAF) as defined
by Van Straalen and Van Leeuwen (2002). Inverse use (from the
y
-axis) provides the environmental
quality criterion (EQC). In this case, it is shown as the hazardous concentration (HC) for 5% of the species.
(Modified after Posthuma et al. 2002.)
y
-axis to the
x
et al. 1992). Risk assessment of chemicals is normally aimed at the protection of human health or
at the protection of ecosystems (and organismal biodiversity) as such. The interrelationships of
these two aims are obvious. Discharge limits and cleanup values for environmental protection are
based on how much of a contaminant can be tolerated by the more highly sensitive species exposed
to it. By looking at the distribution of sensitivities (Figure 16.2) of all tested species to particular
chemicals and selecting a value that includes 95% of the variability, most species can be protected
for most of the time (Van Straalen 2001). The use of distribution-based extrapolation methods has
been criticized, but the outcome often seems to agree with data from field experiments.
The use of earthworms in risk assessment programs is twofold. Apart from protecting earth-
worms as beneficial organisms, earthworms are used to obtain information on environmental quality
and to ensure environmental safety in general. The overall aim is to derive ÑacceptableÒ concen-
trations of particular toxicants in soil. The earthworm is therefore used as a sensitive indicator or
Ñresponder.Ò The consensus seems to be that, although there is no single species of earthworm
sensitive to all kinds of chemicals, the species
can still fulfill this role to some extent.
However, extrapolating directly from earthworms to other species is seldom useful. Species from
different taxa vary greatly in their response to toxicants. Van Straalen and Van Gestel (1993)
approached this problem by applying a safety factor to data obtained with indicator species to
ensure the protection of ÑallÒ species in an ecosystem.
This safety factor is usually based on the variability of the toxicity data. Van Straalen and
Denneman (1989) followed Kooijman (1987) in developing a new approach for estimating a
benchmark concentration
E. fetida
). These statis-
tical methods apply only to toxicity data for single species and provide a useful way of deriving
environmental quality criteria (EQC; Figure 16.2). Application of such a model to earthworm
toxicity data was attempted by Van Straalen (1990). A comparison between NOEC values of five
chemicals in soil to
HC
(hazardous concentration for a selected percentage
p
p
and other soil invertebrates suggested the use of a safety factor greater
than 20, and preferably 100, to protect more sensitive species.
The use of such types of extrapolation methods was discussed by Forbes and Forbes (1994) and
Van Straalen (2001). Van Straalen (2001) admitted that extrapolation factors, safety factors, and
uncertainty factors have limited scientific basis, lack flexibility, and often give unrealistically low
E. fetida