Agriculture Reference
In-Depth Information
TABLE 7.2
Nucleotide Structure of 16S rDNA and Cytochrome
c
Oxidase Sequences
in
Octodrilus
Species
16S
COI
bp
Octodrilus
Species
GC%
AT%
GC/AT
bp
GC%
AT%
GC/AT
O. aporus
497
41.05
58.15
0.70
672
46.43
52.83
0.87
O. b. bihariensis
476
41.18
58.82
0.70
652
46.01
53.83
0.85
O. b. rendzinicola
476
40.97
59.03
0.69
650
46.77
53.08
0.88
O. compromissus
475
39.79
60.21
0.66
651
45.01
54.84
0.82
O. excacystis
474
38.82
60.13
0.64
651
47.00
53.00
0.88
O. frivaldszkyi
476
41.18
58.61
0.70
650
44.46
53.38
0.83
O. permagus
500
41.40
57.80
0.71
667
46.63
52.77
0.88
bp = base pairs; A = adenine; C = cytosine; G = guanine; T = thymine
Biomphalaria
O. exacystis
O. compromissus
O. aporus
O. permagnus
O. frivaldszkyi
O. b. bihariensis
O. b. rendzinicola
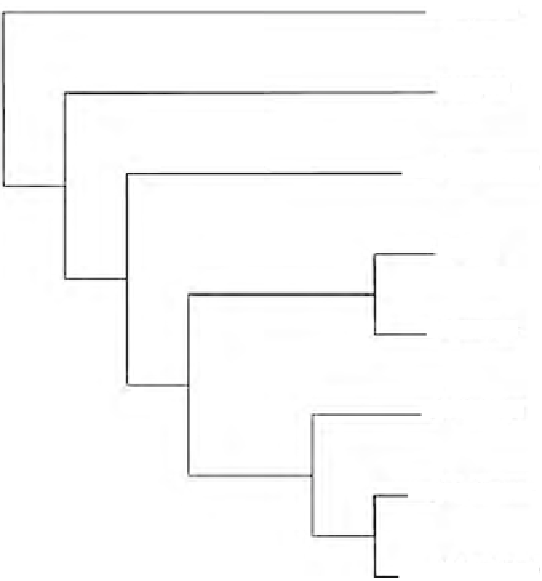
FIGURE 7.5
Maximum parsimony tree from six
Octodrilus
species based on 16S rDNA analysis.
COI Gene Sequences
The parsimony analysis of molecular data (654 bp) resulted in an optimal tree with length 494,
consistency index 0.7753, homoplasy index 0.2247, and retention index 0.4011. Of the 654 nucle-
otide positions, 357 (54.59%) were constant, 153 (23.39%) were parsimony uninformative, and
144 (22.01%) were parsimony informative.