Graphics Programs Reference
In-Depth Information
After a pause, indicators from the analysis
should appear in the model.
10. Under Visual Options, check all of the
options under Road.
You should see various colored areas
representing different key findings for the
analysis.
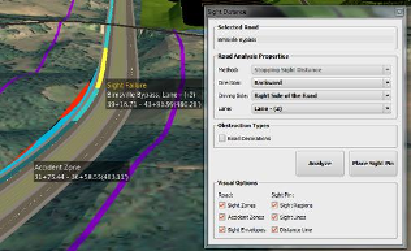
11. Hover you cursor in the yellow area.
Note the tooltips that indicate the Sight
Failure and Accident Zone areas, as shown
in
Figure 3-16
. The failure is caused by the
embankment (highlighted in orange) that is
obstructing a driver's view of the required
sight distance.
Figure 3-16:
Sight Failure and Accident
Zone areas revealed by a sight distance
analysis
Search WWH ::

Custom Search