Geology Reference
In-Depth Information
10
5
10
4
10
3
10
2
10
1
0.7
0.8
0.9
1.0
1.1
Frequency in cycles per year (cpy)
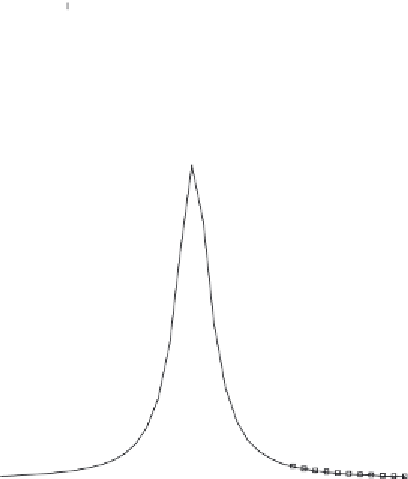
Figure 4.8 Detailed plot of the Chandler resonance and annual features of the
maximum entropy spectral density.
5
4
3
2
1
0.82
0.83
0.84
0.85
0.86
Frequency in cycles per year (cpy)
Figure 4.9 Fit of the Chandler resonance to the curve in expression (4.15).
Squares mark the locations of the maximum entropy spectral estimates.
In order to recover the parameters of the Chandler wobble resonance, we fit a
resonance curve with the form
a
2
(4.15)
4
Q
2
(
f
f
0
)/
f
0
2
1
+
−
to values of the spectral density above 500 (0.
01)
2
/cpy. The resulting fit is shown
in Figure 4.9. The recovered peak amplitude is
a
2
48,775 (0.
01)
2
=
/cpy.
The recovered central frequency is
f
0
0.83813 cpy, equivalent to a period of
435.8 days. The recovered quality factor
Q
is found to be 228.
=


Search WWH ::

Custom Search