Graphics Reference
In-Depth Information
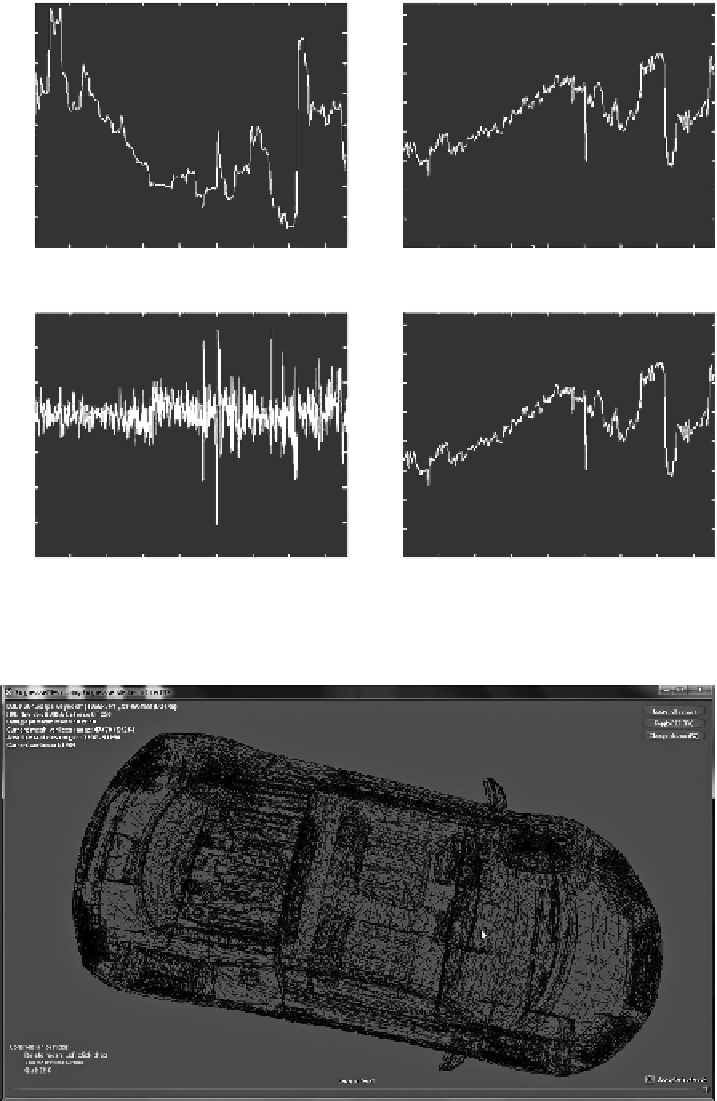
Input
Plant Output
×10
4
10
160
9
8
140
120
100
80
60
40
20
7
6
5
4
3
2
0 0
100
150
200
250
300
350
400
0 0
100
150
200
250
300
350
400
Error
NN Output
0.6
160
0.4
140
120
100
80
60
40
20
0.2
0
-0.2
-0.4
-0.6
-0.8
0 0
100
150
200
250
300
350
400
0 0
100
150
200
Time (s)
250
300
350
400
Time (s)
FIGURE 4.9
Data collected from Experiment 2.
FIGURE 4.10
(See colour insert.)
Screenshot of rendering application in Experiment 3.
Search WWH ::

Custom Search