Graphics Reference
In-Depth Information
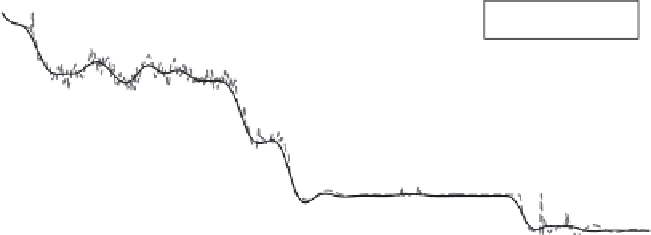
Measured and Predicted Output
10
Predicted output
Measured output
9
8
7
6
5
4
3
2
1
1.01
1.02
1.03
1.04
1.05
1.06
1.07
1.08
1.09
1.1
×10
4
Frame
FIGURE 3.21
Measured output and predicted output from Model C.
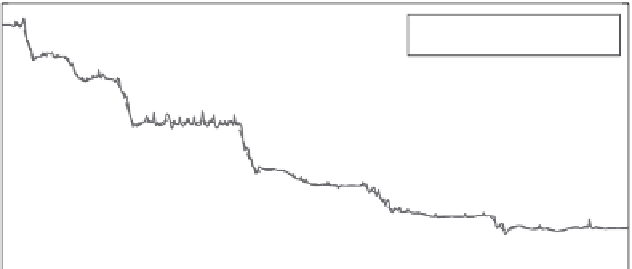
Output of Model C versus the Output from Models A and B
35
Output of Model C
Output of Models A and B
30
25
20
15
10
5
0
0
200
400
600
800
1000
1200
1400
1600
1800
2000
Frame
FIGURE 3.22
Comparison of outputs from Model C and summed outputs of Models A and B.
We can observe from these figures that the outputs from the derived system
models match closely with the actual measured outputs from the rendering process.
Model A's output has a mean error of less than 0.2 ms over a validation range of
10,000 frames. Model B's output mean error is approximately 3 ms for 17,000 frames.
Figure 3.21 indicates that the mean error from Model C's output is approximately
1 ms over 11,000 frames which may be considered very low.
Recall from Section 3.8.1 the description of the principle of superposition based
on Equations (3.18) and (3.19). The accuracy of the derived system models allowed
us to proceed further with validating the principle of superposition by comparing the
sum of the individual output of Models A and B with the output of Model C as shown
in Equation (3.18) based on the same input data.
From Figure 3.22, we can see that the outputs from Models A and B follow that of
Model C very closely. From the experiment data, the peak error is less than 3 ms and


Search WWH ::

Custom Search