Graphics Reference
In-Depth Information
TABLE 3.4
Parameters of ARX Model in Experiment 2
Parameter
Calculation
A(q)
1 - 1.937 q
-1
+ 1.019 q
-2
- 0.2182 q
-3
+ 0.1363 q
-4
B1(q)
-4.702 × 10
-5
q
-1
+ 4.257 × 10
-5
q
-2
+ 5.496 × 10
-5
q
-3
- 5.051 × 10
-5
q
-4
B2(q)
2.918 q
-1
- 8.402 q
-2
+ 7.855 q
-3
- 2.37 q
-4
Operating point
u1 = 1.7839 × 10
5
, u2 = 4.3704, y = 109.0672
close to the actual measured data signalling a highly accurate system model. The
diagrams in the middle and bottom are snapshots of the inputs corresponding to
this measured output.
3.6.3 e
xPeRiment
3
The objective was to adapt our modelling framework to another application and
more importantly demonstrate the possibility of constructing a control system that
provides stable frame rates based on this system model. Again, we first derived
the rendering process model using experiment data collected from the applica-
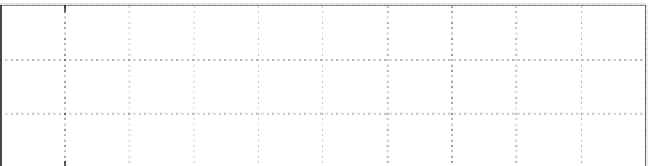
tion. Figure 3.13 illustrates a profile of this data. After a suitable system model
Frame Rate (Output)
450
400
350
300
0
0.5
1
1.5
2
2.5
3
3.5
4
4.5
5
×10
4
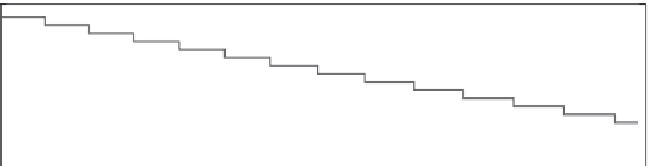
Ve rtex Count (Input)
×10
4
4.5
4.25
4
3.75
3.5
0
0.5
1
1.5
2
2.5
3
3.5
4
4.5
5
×10
4
Frame
FIGURE 3.13
Profiles of input and output of rendering system in Experiment 3.


Search WWH ::

Custom Search