Graphics Reference
In-Depth Information
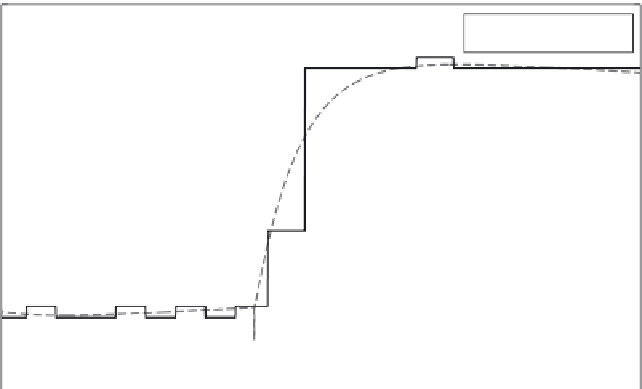
Measured and Simulated Model Output
120
Simulated output
Measured output
115
110
105
100
95
90
85
1.4
1.42
1.44
1.46
1.48
1.5
1.52
1.54
1.56
1.58
1.6
×10
4
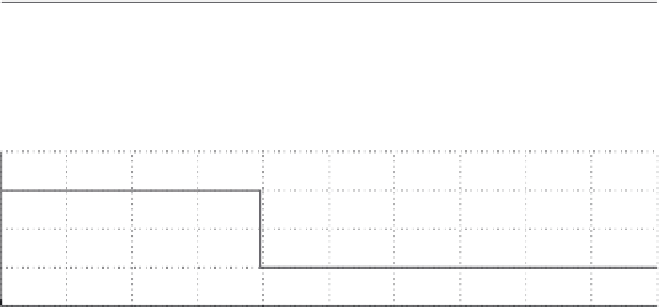
Frame
(a)
×10
5
2
Input 1 − Vertex count
2
2
2
2
1.4
1.42
1.44
1.46
1.48
1.5
1.52
1.54
1.56
1.58
1.6
×10
4
5.5
Input 2 − Shader value
5
4.5
4
3.5
1.4
1.42
1.44
1.46
1.48
1.5
1.52
1.54
1.56
1.58
1.6
×10
4
Frame
(b)
FIGURE 3.12
Measured and simulated outputs of MISO rendering system in Experiment 2.


Search WWH ::

Custom Search