Graphics Reference
In-Depth Information
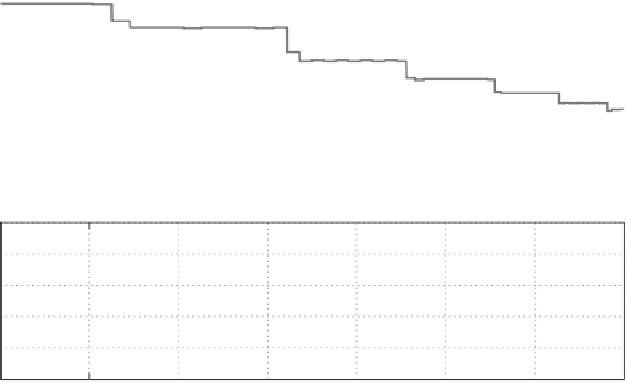
Output
150
125
100
75
50
25
0
0
500
1000
1500
2000
2500
3000
3500
Frame
Input
×10
5
10
8
6
4
2
0
0
500
1000
1500
2000
2500
3000
3500
Frame
FIGURE 3.6
Input and output profiles of application in Experiment 1.
Frame Rate vs Ve rtex Count
140
120
100
80
60
40
20
0
1
2
3
4
5
6
7
8
9
×10
5
Vertex Count (Input)
FIGURE 3.7
Steady-state frame time and vertex count relationship in Experiment 1.


Search WWH ::

Custom Search