Graphics Reference
In-Depth Information
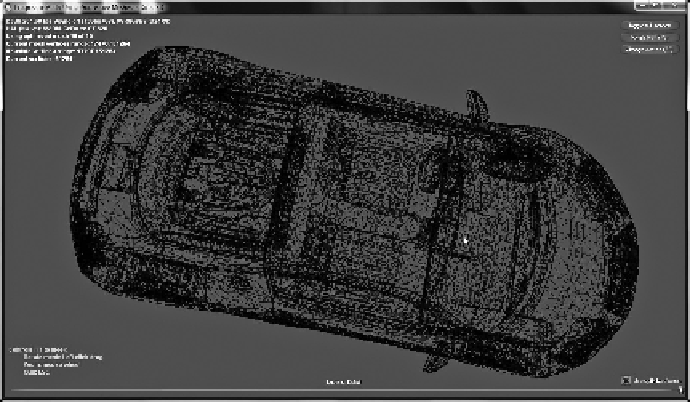
FIGURE 3.5
(See colour insert.)
Screenshot of application in Experiment 3.
ranged from 38,000 to 45,000 vertices and the frame rate (output) between 330 and
400 FPS (see Figure 3.13).
After we obtained the rendering system model in MATLAB
®
, we exported it to
Simulink
®
for control system design. In Simulink, we constructed a feedback loop
and introduced a PID controller to correct the error between the simulated model
output and the user-defined performance target (frame rate). In a similar way, this
architecture may be implemented in interactive rendering software to achieve a con-
stant frame rate.
All experiments were run on a desktop computer with an Intel Core2 Quad CPU
at 3 GHz, with 8 GB of main memory and NVIDIA GeForce GT 320 graphics
processor hardware (with 4 GB video memory) on a 64-bit Windows 7 operating
system. Since the experiments were run on a generic Windows PC, we were aware
of the system processes that may have shared the computing resources during data
collection. To best preserve the integrity of the experiment data, changes of inputs
to the rendering process were introduced programmatically rather than via mouse
input. The system identification toolbox [31] in MATLAB/Simulink was used for
modelling rendering processes in all the experiments.
3.6
RESULTS
3.6.1
e
xPeRiment
1
Using the sample application from DirectX SDK as shown in Figure 3.3, we can
observe from Figure 3.6 that as the input vertex count increases due to greater
tessellation, the frame rate decreases. This relationship is further plotted in Figure 3.7
where the impact on frame rate due to vertex count increase is shown.
Search WWH ::

Custom Search