Graphics Reference
In-Depth Information
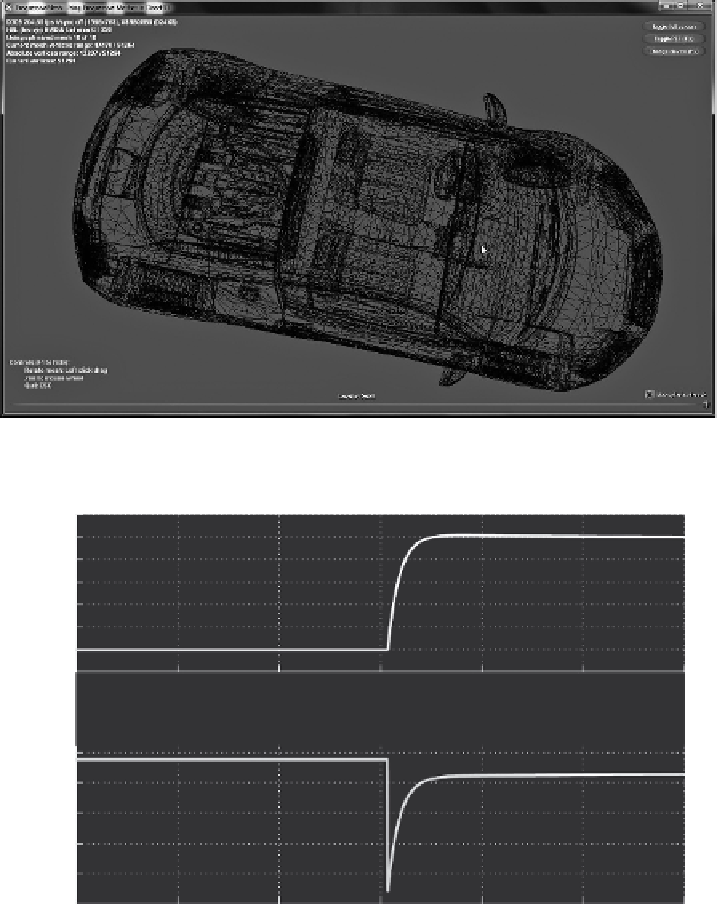
FIGURE 8.5
Screenshot of application in our experiment.
Simulated Input and Output of Rendering Process
420
410
400
390
380
370
360
35
1.22
1.225
1.23
1.235
Frame
1.24
1.245
1.25
×10
5
×10
4
-1.5
-2
-2.5
-3
-3.5
-
1.22
1.225
1.23
1.235
Frame
1.24
1.245
1.25
×10
5
FIGURE 8.6
Reference tracking using PID controller (low to high).
to power levels. For instance, it can start with a default 60 FPS when power is full
and change progressively until it reaches 20 FPS at very low power levels. A mecha-
nism like this enhances the usability of the application across a wide operating range
but calls for a technique that is robust and flexible enough to support it.
Figure 8.8 shows Li and Shen's research output in time-critical multi-resolution
volume rendering [80]. Their algorithm improves the quality of the output which
Search WWH ::

Custom Search