Graphics Reference
In-Depth Information
120
1000
FPS
Ta rget FPS
Polygons
100
750
80
60
500
40
250
20
0
0
0
40
60
10
20
30
50
Time (seconds)
700
120
Downloadings
Loaded tiles
Rendered tiles
600
100
500
80
400
60
300
40
200
20
100
0
0
0
40
60
10
20
30
50
Time (seconds)
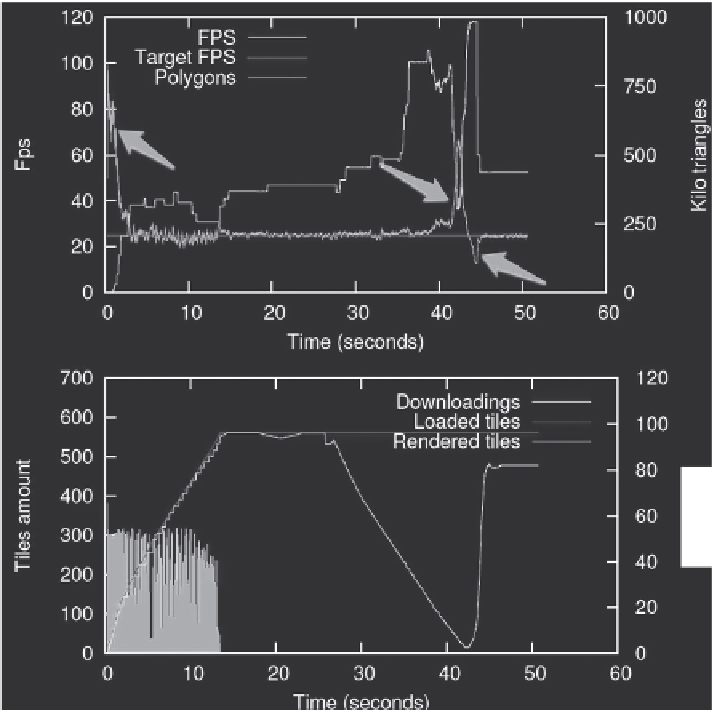
FIGURE 8.1
Experiment results from Pouderoux and Marvie's research [78].
ascribes to the “best-effort” design. Paravati et al.'s [66] adaptive control system did
not deliver stable frame rates as well as shown in Figure 8.4 rather the depicted frame
rates bear an oscillatory behavior after some steady-state equilibrium.
From a quantitative perspective, all the aforementioned research produced errors
in frame rates of more 100% from the target value.
For the purpose of comparison and clarity, we reproduce Figure 5.12 and 5.13
below as Figures 8.5 and 8.6. It can be seen that our proposed modelling and control
framework creates absolutely stable frame rates with less than 3% error.
8.1.2 t
Ransient
R
esPonse
The transient response of a 3D rendering application refers to the quality of its transi-
tion as the frame rate changes from one steady-state level to another typically due to
changing performance objective. This quality is particularly important at low frame


Search WWH ::

Custom Search