Graphics Reference
In-Depth Information
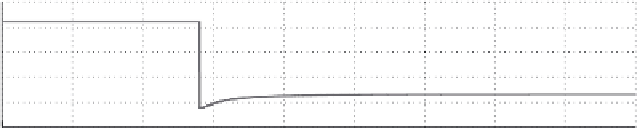
Simulated Input and Output of Rendering Process
400
Output
390
380
370
360
4.2
4.4
4.6
4.8
5
5.2
5.4
5.6
5.8
6
×10
4
Frame
×10
4
−1.6
Input
−1.65
−1.7
−1.75
−1.8
−1.85
4.2
4.4
4.6
4.8
5
5.2
5.4
5.6
5.8
6
×10
4
Frame
FIGURE 6.9
Reference tracking using fuzzy controller (low to high).
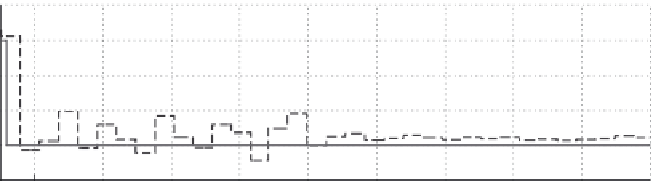
Measured Input and Output of Rendering Process
410
Measured output
Reference
400
390
380
370
360
0.2
0.4
0.6
0.8
1
1.2
1.4
1.6
1.8
2
×10
5
Frame
×10
4
4.55
Input
4.5
4.45
4.4
4.35
0.2
0.4
0.6
0.8
1
1.2
1.4
1.6
1.8
2
×10
5
Frame
FIGURE 6.10
Reference tracking using fuzzy controller (to lower FPS).
logic controller was able to reduce the frame rate after adjusting the load of the ren-
dering process. This adjustment took place over approximately 9,000 frames with an
observable error of about 3 FPS.
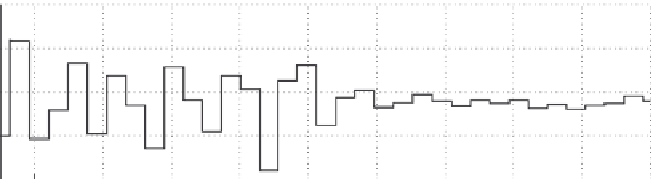
In Figure 6.11, the frame rate increases from 370 FPS to a target of 400 FPS.
Again, the fuzzy logic controller can reduce the load and track the new reference


Search WWH ::

Custom Search