Graphics Reference
In-Depth Information
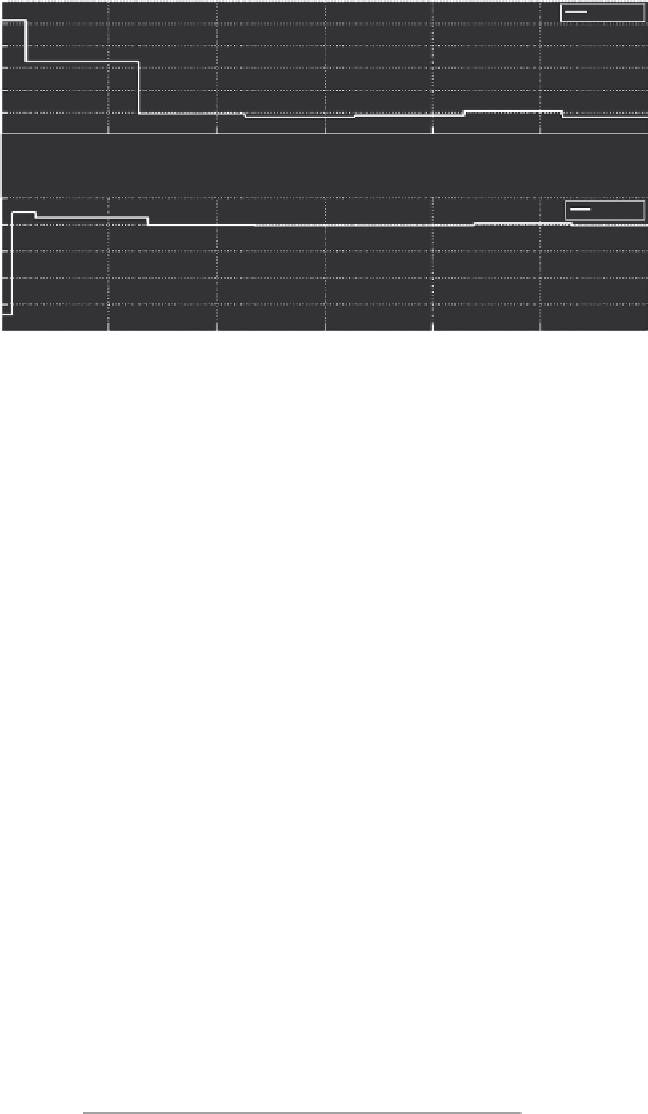
Measured Input and Output of Rendering Process (PID controller, reference: 380 FPS)
405
400
395
390
385
Output
380
375
0
2
4
6
Frame
8
10
12
×10
4
×10
4
4.75
Input
4.7
4.65
4.6
4.55
4.5
0
2
4
6
Frame
8
10
12
×10
4
FIGURE 5.16
Reference tracking using PID controller (to lower FPS).
reference level lower than its initial reference rate (400 FPS). We can see that the
controller takes approximately the same time (25,000 frames) to bring the frame rate
down to the lower reference level.
Both phases of the second experiment showed consistency in plant response
time and the control action was able to track the reference level eventually. This
indicates that the system model representation is reasonably accurate and that the
PID controller was tuned adequately to work with the actual rendering process.
5.5.3 g
ain
s
cheduling
c
ontRol
s
ystem
With reference to Section 5.3.3 covering the application of PID control over an oper-
ating range involving non-linear characteristics, we wanted to validate the applica-
bility of the gain scheduling control strategy in such a scenario. First, an extended
operating range was selected and divided into three segments as shown in Table 5.1.
We modelled the rendering process within these segments at various operating
points. A corresponding controller was designed at every operating range and its
parameters were preset into the PID controller shown in Figure 5.8 for the purpose
TABLE 5.1
Linear Operating Ranges
Linear Range Reference
Approximate Frame Rate Range
1
390-450
2
389-325
3
324-280
Search WWH ::

Custom Search