Graphics Reference
In-Depth Information
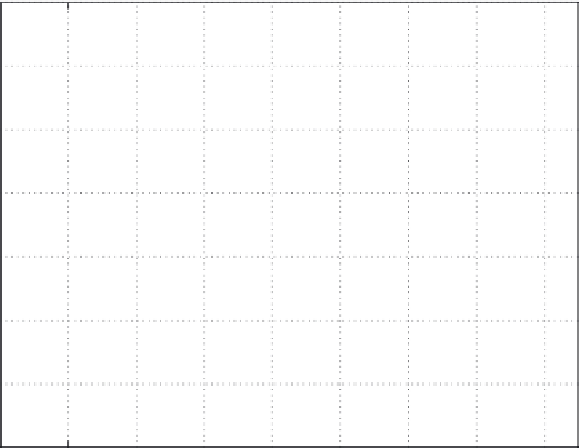
Frame Rate vs Ve rtex Count
140
120
100
80
60
40
20
0
1
2
3
4
5
6
7
8
9
×10
5
Vertex Count (Input)
FIGURE 5.7
Steady-state frame time and vertex count relationship shown in Experiment 1.
5.3.3 g
ain
s
cheduling
foR
n
on
-l
ineaR
R
endeRing
P
Rocess
m
odels
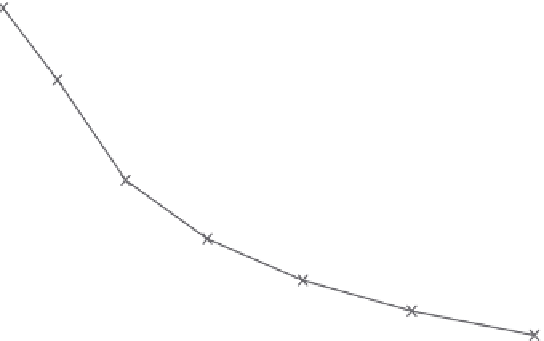
As mentioned in Chapter 4, the real-time rendering process exhibits non-linearity
characteristics. Prior research [38] demonstrates that the time taken to render a
vertex differs with changing rendering loads. Figure 5.7 (originally Figure 3.7 from
Chapter 3) is reproduced here and clearly shows this property.
We can observe from the figure that a single line segment approximation of the
system's input-output relationship is inadequate. One approach to the challenge of
designing a control strategy to counter this problem is to resolve the non-linearity
at a piecewise level. In other words, we can approximate the system's input-output
relationship with a series of line segments at selected operating points instead of
using a single line across an entire operating range.
Each line segment represents a region whereby the plant may be modelled using
linear model structures. Thereafter a suitable PID controller can be designed and intro-
duced to achieve the desired performance for a delta region near a particular operat-
ing point. It is important to note the intention of Figure 5.7 is not to dictate or convey
the number of segments to use for any particular application. It is produced to verify
the existence of non-linearity in the rendering process. In practice, the number of
linear segments to use is dependent and specific to the user's modelling requirements.
Because numerous combinations of line segments can approximate the curve
shown in Figure 5.7, we can approach this optimal allocation of line segments to
describe the non-linear input-output relationship as a constrained optimisation


Search WWH ::

Custom Search