Geoscience Reference
In-Depth Information
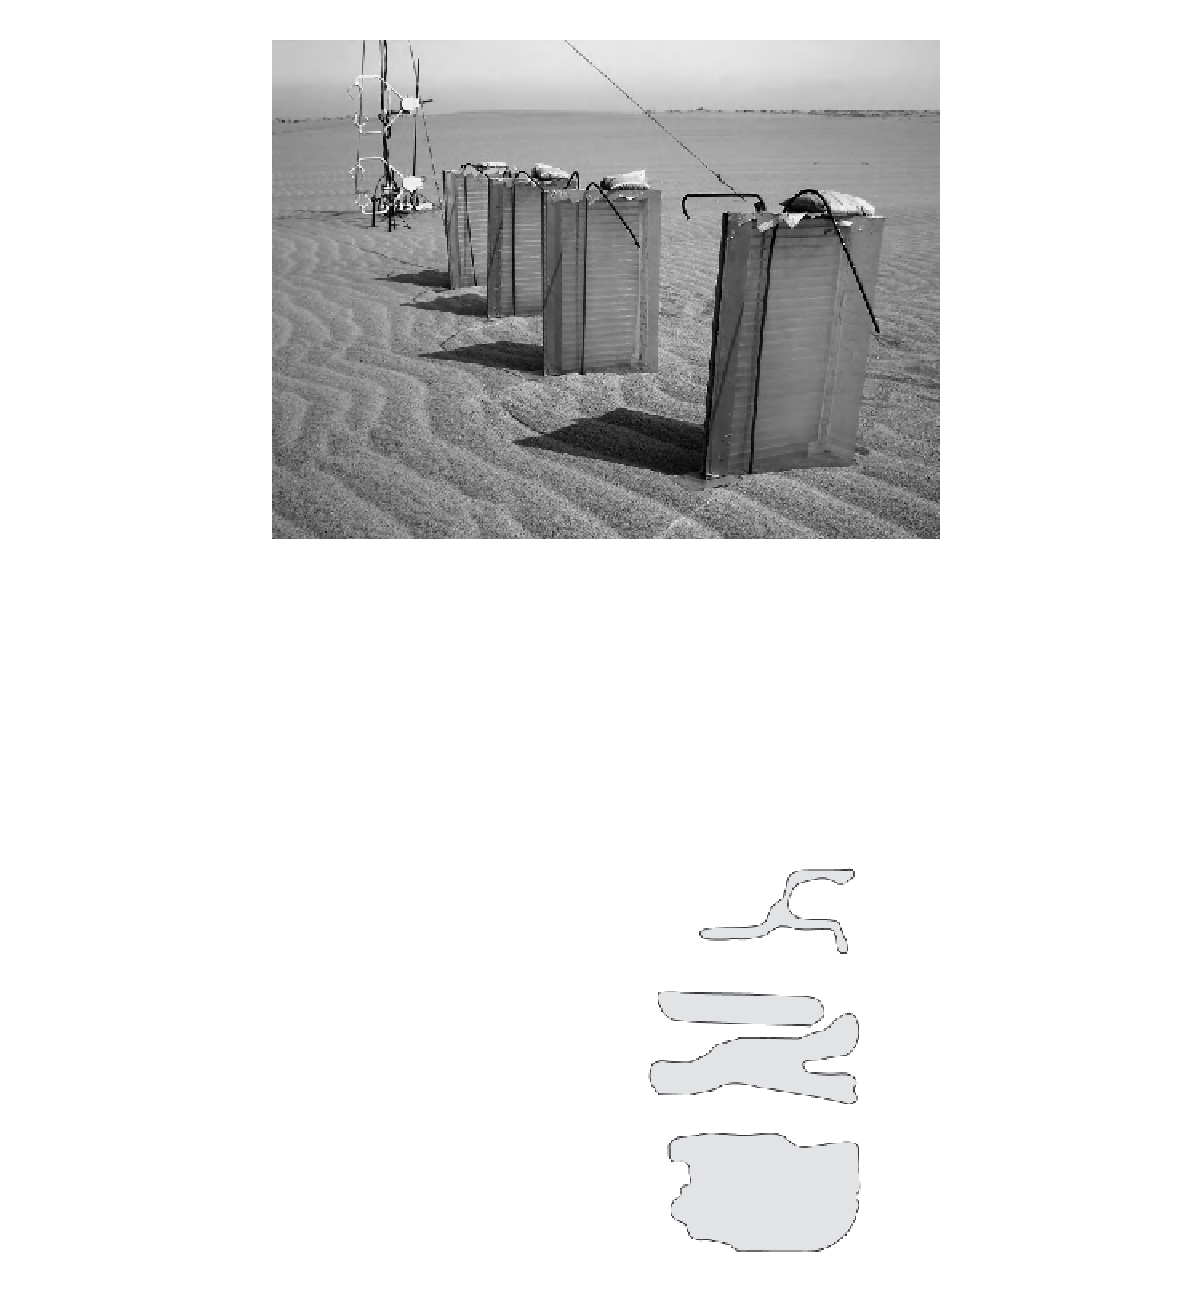
Figure 18.23
A series of isokinetic wedge-shaped sand traps measuring sand flux in the field. For comparison two saltation
impact responders can also be seen at the base of the sonic anemometers towards the left of the photograph (photo: author).
similar basis of responding to the individual impacts of
saltating grains on a sensitive surface. In the case of the
Saltiphone, this surface is a highly responsive microphone
(Arens, 1996; Schonfeldt and von Lowis, 2003; Sterk, Ja-
cobs and van Boxel, 1998; Zobeck
et al.
, 2003), while in
the case of the Sensit and Safire, the surface is a piezo-
electric transducer (Gillette and Stockton, 1989; Stout and
Zobeck, 1997; Baas, 2004). The advantage of such instru-
ments over traditional sand traps is that they are small,
offer little resistance to the flow and are omnidirectional
in response. They also allow high-frequency and instan-
taneous assessment of saltation activity, something that
can only be achieved with a sand trap if a dynamic load
cell is incorporated into the design, a technique that is
generally restricted to wind tunnel applications (although
see McKenna-Neuman, Lancaster and Nickling, 2000).
However, while such sensors have been shown to be very
capable of identifying the onset of saltation and inter-
mittency in saltation dynamics, they are less reliable for
quantifying the actual saltation flux (van Pelt, Peters and
Visser, 2009).
A considerable difficulty in characterising saltation ac-
tivity using sand flux collectors or impact responders in
the field arises from the very nature of saltation. Baas and
Sherman (2005) and Baas (2008) recognise that saltation
does not occur as a homogeneous 'curtain' across an erod-
ing surface; rather it most often occurs in the form of tem-
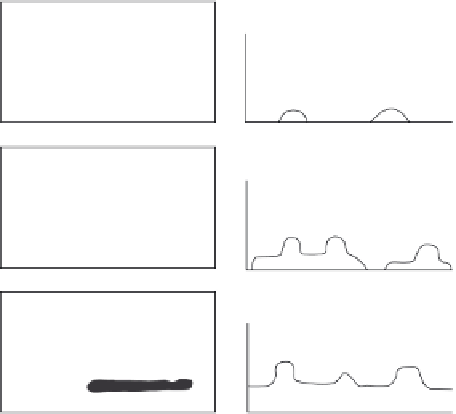
'snake' across the surface in an ever-changing weaving
pattern (Figure 18.24). This poses significant measure-
ment problems, for within a continuously saltating envi-
ronment sand traps and saltation impact responders are
sometimes in contact with these streamers but, equally,
Contour map
Spanwise transect
streamer family
nested streamers
clouds with embedded streamers
time (x-axis)
array (y-axis)
Figure 18.24
Characteristics of observed sand streamer pat-
terns in plan view (left) and cross-section (right) (from Baas