Geoscience Reference
In-Depth Information
10
5
u
*
1
u
*
2
1
0.5
0.1
0.05
0.01
0.005
z
0
h
0.001
0.0005
d
z
0
0.0001
0
100
200
0
100
200
Velocity (m min
-1
)
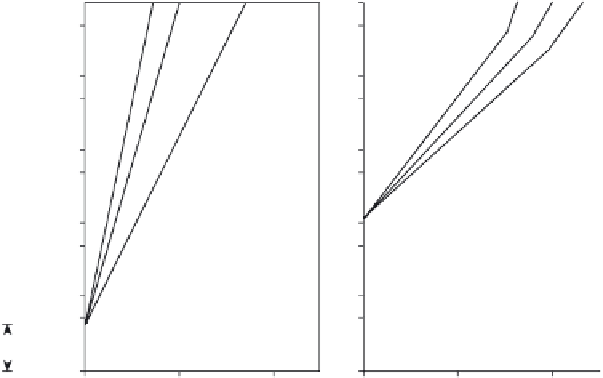
Figure 18.8
Vegetation effect on velocity profile structure:
d
=
zero-plane displacement,
h
=
mean vegetation canopy height,
u
∗
2
>
u
∗
1
.
results in an increased
u
∗
above the vegetation canopy.
From measurements on vegetated and bare dunes in the
Kalahari Desert, Wiggs
et al.
(1994) found threefold in-
creases in above-canopy
u
∗
and 200 % reductions in near-
surface wind velocity on vegetated dune surfaces.
The value
d
in Figure 18.8 (and Equation (18.3)) is
the
zero-plane displacement
height and is the level of
the mean momentum sink and the elevation at which the
mean drag appears to act (Thom, 1971; Jackson, 1981).
A practical explanation of the physical meaning of
d
can
be given within the context of Figure 18.7. In an isolated-
flow roughness regime where roughness elements (e.g.
vegetation) are widely spaced, each individual roughness
element provides a drag on the airflow and so
z
0
is de-
termined by the geometry of the roughness elements and
d
would be small enough to ignore. At the opposite ex-
treme, with dense roughness elements, the wakes of each
element interact, resulting in wake interference or skim-
ming flow (Figure 18.7). In this case it is clear that the
aerodynamic roughness (
z
0
) would be controlled only by
the very tops of the vegetation canopy and so the effective
drag provided by each individual roughness element is
considerably reduced. The value of
z
0
therefore decreases
markedly (in comparison to isolated roughness flow) but
the height at which that aerodynamic roughness oper-
ates is displaced upwards by the zero-plane displacement
height (
d
), a value that, in this example, may approach the
scale of the roughness elements themselves.
Vegetated surfaces are therefore seen to have conflicting
influences on aeolian erosion. When compared to a bare
surface, a vegetated surface induces a lower near-surface
wind velocity (which would tend to diminish erosion) but
also a higher
u
∗
in the airflow (which would tend to en-
hance erosion). A question therefore arises as to the height
above the surface at which the additional energy from an
enhanced
u
∗
is effective. In the case of skimming flow
(Figure 18.7) with a large value of
d
, that energy is func-
tional near the top of the vegetation canopy and therefore
has little influence on surface erosion. However, with more
isolated roughness elements the vertical displacement of
the velocity profile may not be sufficient to counteract the
increased erosional effects of an enhanced
u
∗
, and the ex-
tra wind stresses may be applied on the surface sediment,
thus increasing erosion potential.
A real difficulty from a sediment transport perspective
wth regard to predicting both dust emission and sand en-
trainment is in determining the proportion of
u
∗
that acts
on the surface, compared to the proportion that acts on
any distributed nonerodible roughness elements. Much
research has been undertaken to define a parameter that
would successfully take account of the impact on the air-
flow of the geometry and spacing of nonerodible rough-
ness elements. Methods for partitioning the shear stress
between that acting on a vegetation canopy and that af-
fecting the surface often make reference to the rough-
ness density (
) (Gillette and Stockton, 1989; Musick and
Gillette, 1990; Stockton and Gillette, 1990):
λ